New Donchian channel indicator “Modern Donchi”
Price on the market rarely moves constantly in the same direction; most often it forms price channels.

Therefore, the trading strategy in the price channel is one of the most popular in stock trading.
Today, few people build price channels manually; traders prefer to use technical analysis indicators in their work.
One of these indicators is the Donchian indicator developed by the famous trader Richard Donchian.
The tool is used to analyze market volatility and determine support and resistance levels.
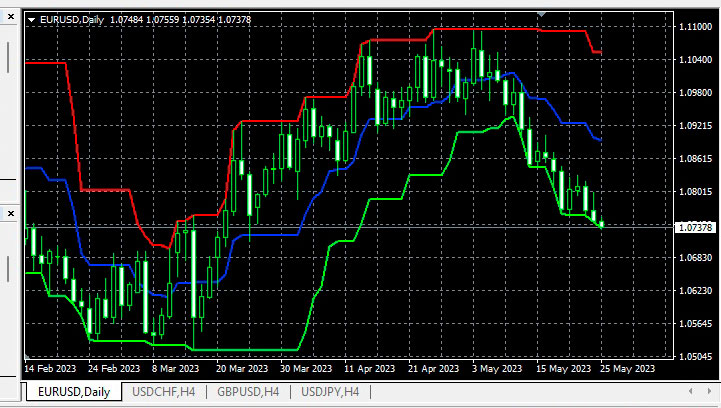
Today we present the Modern Donchi indicator, in which the developer has also added an average line, it displays the change in the average price value:

This version of the Donchian channel indicator can be used to determine trends, support and resistance levels, and potential level breakouts. Strategy for level breakouts
When the price breaks through the upper line of the channel, this is considered a bullish buy signal, and a breakdown of the lower line of the channel is considered a bearish sell signal.
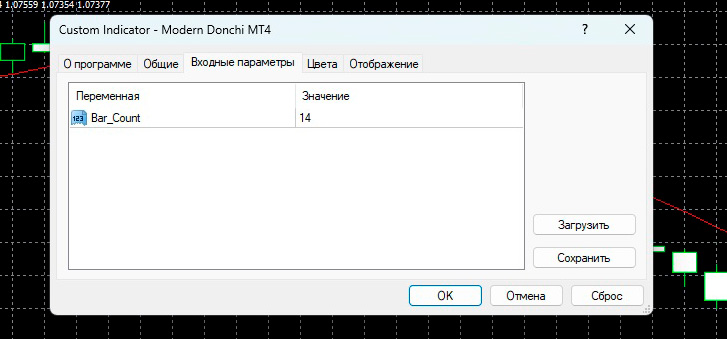
In the indicator, you can configure only one basic indicator, Bar Count:

Bar Count - Number of bars/candles. This is the period during which the indicator will display support and resistance levels.
After adding the indicator to the chart of a currency pair, for greater clarity, you can enable the chart shift in the settings.
The Modern Donchi indicator is designed for installation in the metatrader 4 trading platform; the script will be displayed not only on the selected timeframe, but also on several adjacent ones.
