Tick indicator.
Most traders are accustomed to the fact that the minimum timeframe on a Forex chart is M1, but even within one minute, the price 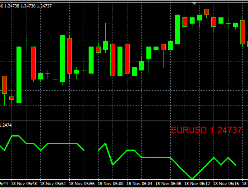 undergoes a significant amount of movement, which is called a tick.
A tick is a price change, the distance between two subsequent quotes, making it the smallest unit of measurement for the price of a currency pair.
The tick indicator allows you to display a tick chart in the standard trader's terminal, clearly showing even the slightest price changes.
It's only practical to use the indicator on a one-minute time frame; on longer timeframes, the tick curve simply becomes a nearly straight line and offers no useful information.
How the script works. After installation, a separate window appears below the currency pair chart. It displays a green curve, the currency pair name, and the current price. The curve itself is always green, but the text changes depending on the direction of the last tick. Green indicates an increase in price. Red indicates a decrease. The tick indicator has no additional settings, other than changing the visual display. This tool is more like a useful script, as it doesn't analyze trends, but only provides additional information. The indicator is designed for scalping traders ; by analyzing its curve, you can find the most favorable market entry point. Download the tick indicator.

