
Redrawing indicators and how to select an indicator without redrawing
When trading on the stock exchange using technical analysis, and especially indicator strategies, every trader has at least once encountered such a phenomenon as redrawing of indicators.
This phenomenon, or to be more precise, a technical feature, has caused damage to more than one thousand traders, since having believed in the strategy algorithm and opened a deal based on a signal, at some point the signal immediately disappears, as if it never existed.
At the same time, if the trend continued and the signal worked, such a disappearance is not observed on the chart.
The most interesting thing is that it is these instruments that instill great faith in the trader that he has finally found the Grail, since such indicators look simply flawless in history.
However, the use of such algorithms can lead to the loss of a deposit, and their main disadvantage is the inability to conduct a more detailed analysis of trading, since the received negative signals are not stored in history.
There can be many reasons why indicators are redrawn, however, as a rule, it all depends on the type of indicator used, as well as the commercial component if you purchased this tool. So, let's look at the main reasons for redrawing indicators.
1) Commerce. Fraudulent intrigues
Many indicators that are sold on various sites are specially created by scammers with elements of redrawing to make the product look more convincing.
So, looking at the description of the indicator, you can almost always see attached screenshots of the indicator on the historical chart.
If the indicator does not redraw, such signals will not look so ideal; moreover, unprofitable signals may also come into your field of vision.
If the picture looks perfect, and all the transactions in the above image are perfect and as if they were a carbon copy, the indicator is most likely redrawn.
Unfortunately, such tools appear thanks to unscrupulous programmers, as well as fraudulent sellers, and this phenomenon will continue in the future.
2) Novelty of the algorithm. Inability to encode an idea
As a rule, a new unique algorithm that has nothing in common with generally accepted technical analysis tools is very difficult to code, which ultimately leads to the appearance of defective indicators with redrawing.
However, if the idea is really worthwhile, in a very short time improved algorithms appear that correct this shortcoming.
It is worth understanding that such indicators are not sold, but distributed by enthusiastic programmers who simply publicly implemented their idea, but simply lacked the skills and experience to complete the development.
3) Dependence of the indicator on the closing price
Almost all standard indicators are redrawn to some extent. However, you should not confuse redrawing the indicator signal before the candle closes with redrawing the signal on history.
So, if the indicator is guided by the closing price of a candle, as the price moves, namely inside the candle, the signal may appear or disappear repeatedly, but after the candle closes the signal will remain in place.
A similar phenomenon can be observed on almost all oscillators, as well as trend indicators, so the main recommendation when working with such instruments is to consider the transaction only after the bar closes.
How to select an indicator without redrawing
In order not to fall into the trap of a signal suddenly disappearing on the chart, it is necessary to test the instrument before starting real trading.
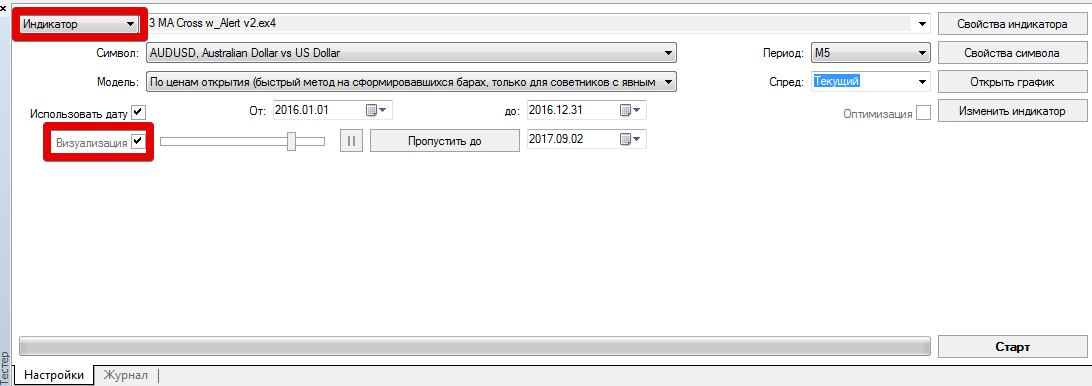
To do this, launch your strategy tester in the MT4 or MT5 trading terminal and select the “Indicator” testing object, then select the indicator that you want to test and run the tester in visualization mode.
Thus, you can see how signals are formed on history, spending just a few minutes on it. You can also check the indicator's performance in real time by dragging the instrument onto a minute chart and observing it for several hours.
If you buy an indicator from a seller, ask them to provide a demo version of the tool.
If the seller is afraid that you will hack him and refuses, ask him to enable desktop display in Skype and then let him run the indicator in the tester in visualization mode on his computer.
This way you can see the performance of the indicator and cut off scammers who are trying to sell you an indicator with redrawing.
In conclusion, I would like to note that redrawing of indicators is a common phenomenon that can be easily eliminated by conducting simple testing.
However, you should understand that when buying an indicator from a stranger, there is a high probability of deception, so do not hesitate to show your skepticism when communicating with the seller!
And ask for a demo version of the product or testing in visualization mode via Skype or other services that will allow you to see the seller’s desktop!