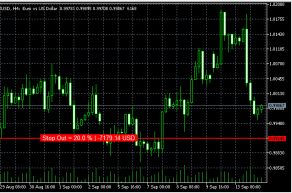
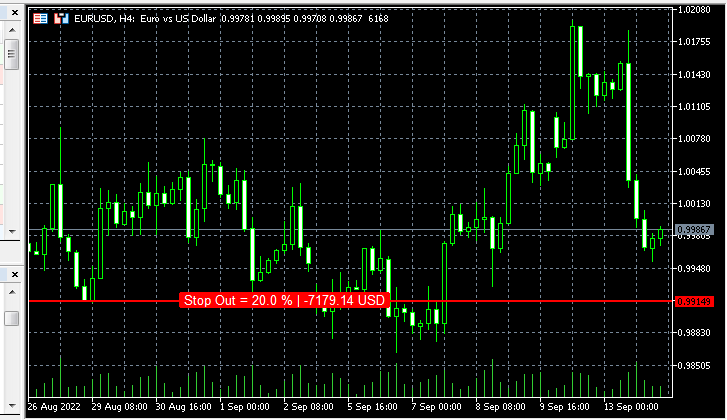
Indicator for displaying the Stop Out line on the chart
Almost everyone who starts trading on the stock exchange using leverage asks the question - what will happen if I lose the broker’s money?

To prevent such situations from happening, there is a kind of stop loss from the brokerage company that protects its money.
This stop order is called Stop Out and its size usually ranges from 10 to 50 percent of the collateral amount for the transaction.
And everything would be fine, but it is quite inconvenient to calculate each time when a forced closure of a position will occur. A Stop Out script was created to automate and visualize the process.

The indicator is designed for the metatrader 5 trading platform, is installed in the “Market” indicators folder and after restarting the program appears in the Navigator in the Market indicators section:

You don’t need to change anything during installation, unless you want to change the color of the line or the color of the text displayed on the screen; you can also set the offset from the edge in the settings.
Data on the chart appears only after opening a position; the larger the volume of open positions, the closer the Stop Out line is to the current price.
When opening two transactions in opposite directions for one asset, the indicator line is not displayed, since the profit on one position compensates for the losses on the other.
