Script for transferring history to chart
Investing in the Forex market is extremely risky, and even huge potential returns in many cases are broken by the realities of the efficiency and stability of managers.

How can you find out if a manager can conduct effective trading?
What is his strategy and, most importantly, aren’t these indicators inflated due to the competent use of risky capital management , which give a beautiful picture of the profitability graph, but at the same time the loss occurs suddenly and simultaneously?
In order to answer this question, you need to study in detail the trader’s trading principle, and additional programs for the trading platform - Forex scripts - will help you.
The script for transferring history to a chart StrategyViewer is an auxiliary program for your MT4 that allows you to extract history from an Excel report, which can often be downloaded by various services for copying transactions and PAMM sites.
It is worth noting that the script was developed specifically to pull transaction histories onto the chart from the signal copying service from the metatrader developer, which are still located directly in your platform.
The script does not open positions and is an auxiliary development that allows you to more clearly see how the manager trades.
Installing the StrategyViewer script
The StrategyViewer script performs very narrow and specific tasks that are of interest primarily to an investor who understands trading on the Forex market, or to an investor who also trades independently and understands the entire trading process.
That is why this script did not appear until 2018, but after its appearance the author published it in the official MT4 developer library.
Thus, you can install the script in two ways, namely either through the library or through the data directory according to the standard scheme.
To install the script through the library, launch the trading terminal and move to the “terminal” panel, where information on your balance is displayed. Then open the “Library” tab and do a simple sorting so that purely scripts appear in the list.
Find the script for transferring history to the chart in the resulting list and download it using the additional menu as shown in the image below:

If you have difficulties installing through the library, you can resort to the standard scheme.
To do this, download the script file at the end of the article and place it in the appropriate folder in the terminal data directory, namely in the folder called Scripts. After installation using any of the methods, you need to update the trading terminal in the navigator panel or completely restart the trading terminal.
Using a script for transferring history to a chart
In order to transfer the history of positions to a chart, the first thing you need to do is acquire a history of positions in CSV format.
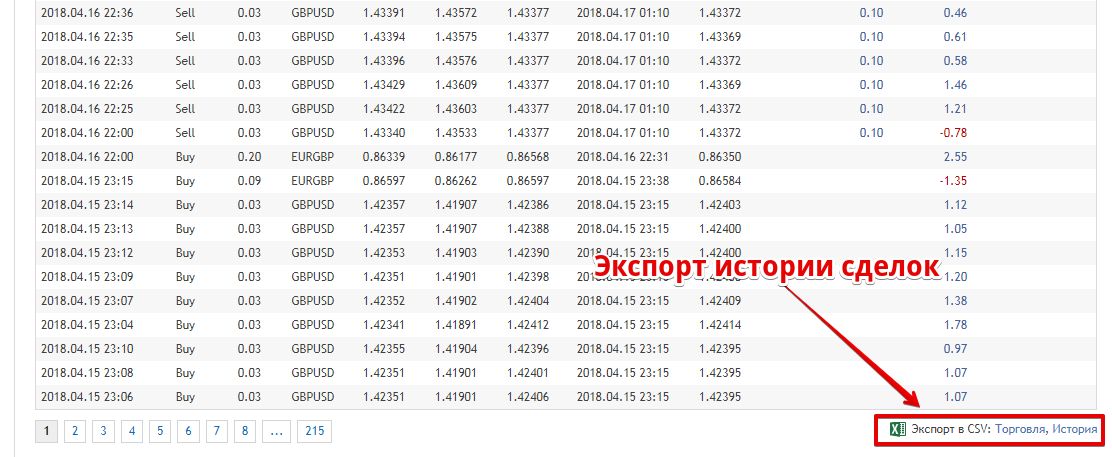
For example, in the service for copying trades from the MT4 developer, you will need to move to the end of the general information on the manager and, if the history is open before connecting, download it as in the image below:

The next step after downloading is to rename the report file name to statement.csv.
Then install it in exactly the same way as an ordinary script, only drop the file itself into a folder called File in your data directory.
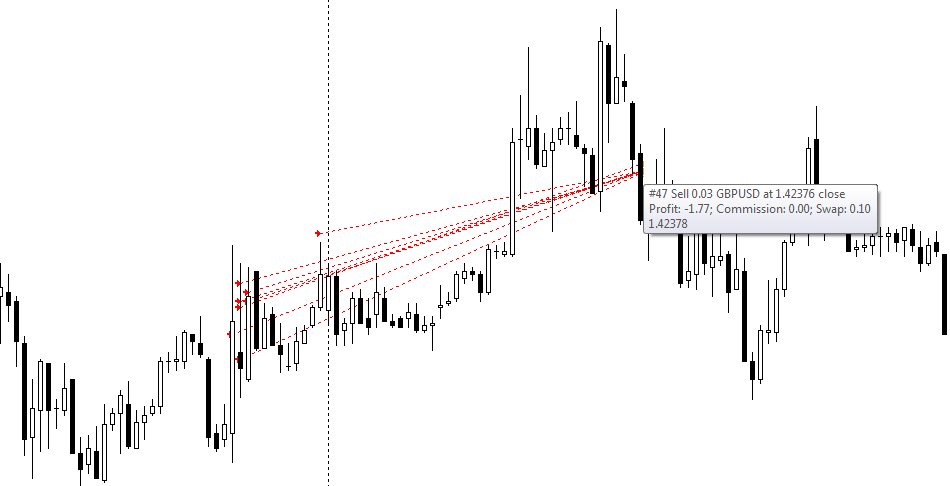
After you install the downloaded report file, simply apply the script to the chart, after which it will display you directly on it labels with transactions for the currency pair on which the manager’s positions are recorded.
It will look like this on the graph:

In conclusion, it is worth noting that the script for transferring history to the chart allows you to more deeply analyze the trading of your manager or signal source.
Understand the principle of trading, the strategy , and most importantly, draw conclusions about how disciplined the trader is and whether it is worth investing in him at all.
Download the script for transferring history to the chart.
