Script highs and lows.
This indicator, which represents the minimum and maximum price for a given time period, is the primary benchmark when planning Forex trades. It allows you to not only determine the current price position but also forecast its future movement. The "Minimum and Maximum" script plots sequential lines connecting the maximum and minimum price values for the day, week, and month. This means you get not just levels, but graphic figures that characterize the trend and help assess the market situation. The script is installed in the "Indicators" folder and added to the chart using the standard scheme; only the color settings can be changed.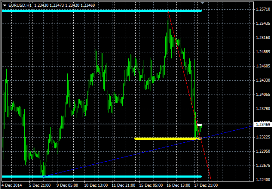
As a result, we see daily, weekly, and monthly price extremes and trend lines that indicate the direction of the trend over the specified time periods.
When trading, the tool is used as follows:
• We evaluate how close the price is to the minimums and maximums.
• We look in which direction the trend lines are directed.
• If the situation is favorable, we open a trade in the direction of the trend.
For example, if the price is at a weekly minimum and begins to rise, we open a buy trade.
The script is more suitable for medium-term and long-term trades.
Download the Highs and Lows Script.

