Forex Smart Trading Strategy
The success of a trading strategy largely depends on the volatility of the currency pair. Anyone who's tried trading on shorter time frames  has noticed that the price, before moving in the desired direction, manages to reverse two or three times, hitting all stops.
This is due to the high volatility of the asset, which, unfortunately, we cannot influence in any way.
The Forex Smart trading strategy suggests that we avoid such unexpected price surges by trading on a four-hour chart.
It's no wonder most professionals trade on daily and four-hour charts; volatility is much lower on these time frames, and you won't encounter any market noise.
To prepare the strategy for work, open the EUR/USD currency pair chart and apply the following indicators to the chart:
1. A linear weighted moving average with a period of 8. You should also apply it to the average price (HLC/3). The line color is blue.
2. A linear weighted moving average with a period of 21. You should also apply it to the average price (HLC/3). The line color is yellow.
3. The Parabolic indicator has a step of 0.0026, and the maximum is 0.5
4. Stochastic oscillator with period K 12, D12, and set the slowdown to 5.
5. MACD with a fast moving average period of 8, a slow one of 21, and a MACD SMA 1. Apply the indicator to (HLCC/4)
To make things easier for you, I've prepared a template that you can download at the end of the article. Install it by pasting it into the Template folder, which you can access through the file/data folder tab of your terminal. After restarting, simply select the "Forex Smart" template from the template list.
If you installed the template correctly, then after launching it, all indicators will appear automatically, and the currency pair chart will look like this:
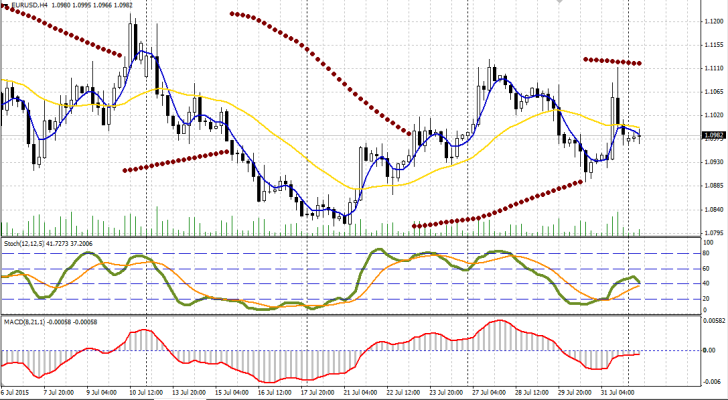
As you may have already noticed, the strategy is based on four standard indicators, the description of which you can read in the Indicators.
Now let's look at the trading signals we'll use to enter a particular position.
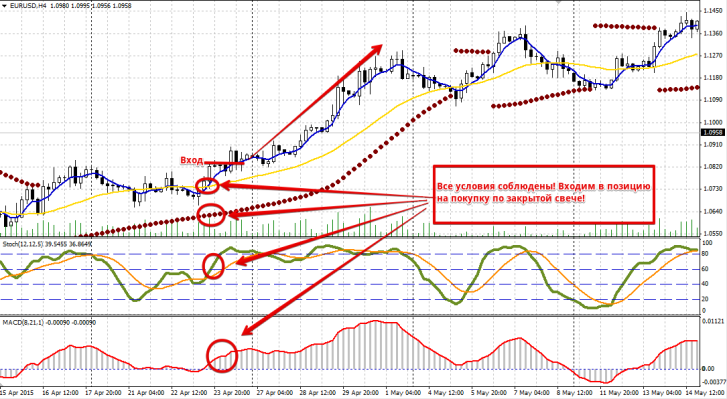
A buy signal occurs when a number of conditions are met:
1. The moving average with a period of 8 crosses the moving average with a period of 21 from the bottom up. (The blue line crosses the yellow line from the bottom up).
2. The Parabolic indicator point is below the price.
3. The MACD indicator histogram is rising or is above level 0.
4. The stochastic oscillator line is rising, but is never in the overbought zone. Ideally, the indicator line is in the oversold zone.
I'd like to emphasize that the intersection of moving averages, in our case, plays a more informative role, indicating a change in trend direction. Therefore, the basis for entering a buy trade is the appearance of a dot on the Parabolic indicator, with a detailed signal filter based on other indicators. You can see an example of a buy entry in the image below:
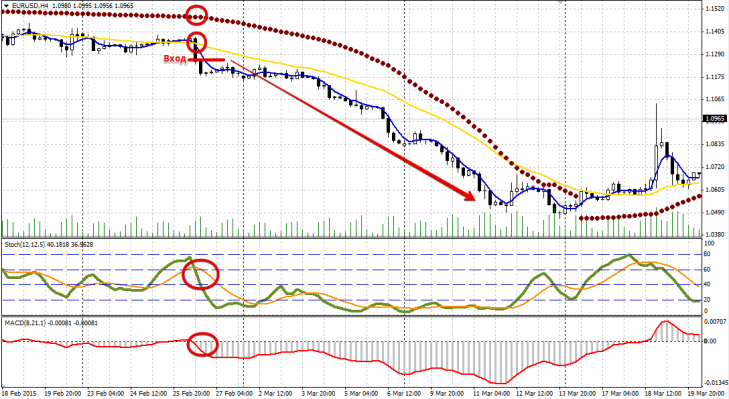
A sell signal occurs when a number of the following conditions are met:
1. The moving average with a period of 8 crosses the moving average with a period of 21 from top to bottom. (The blue line crosses the yellow line from top to bottom).
2. The Parabolic indicator point is above the price.
3. The MACD indicator is falling or is below the 0 level.
4. The stochastic oscillator line is falling, but is never in the oversold zone. Ideally, the indicator line is in the overbought zone.
Enter a position only on a closed bar. Note: if the parabolic indicator was in a different direction after the crossover, but within five candles it reverses as required for a sell signal, you can safely enter the position. You can see an example of entering a sell position in the image below:
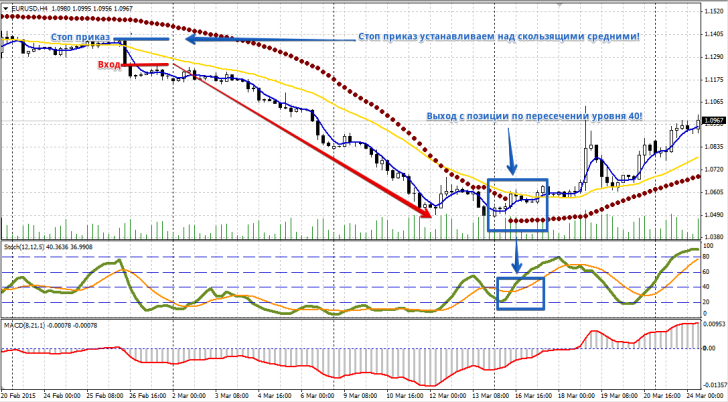
The Stochastic indicator will help you exit your position correctly and avoid holding it too long. Exit a buy position if the oscillator line crosses first 80 and then 60. Exit a sell position if the Stochastic line crosses 20 and then 40.
Simply put, a buy signal to close occurs when level 60 is crossed, and a sell signal occurs when level 40 is crossed. Alternatively, you can use the appearance of a dot on the Parabolic indicator in the opposite direction. We'll limit losses by placing stop orders near local highs or lows, or important levels.
You can also place your stop above moving averages or at the Parabolic indicator. Overall, you have a wide range of options for exiting a position and setting a stop order. You can see an example in the image below:
The strategy performs very well on trending currency pairs, but a review of the trading history reveals that its weakness is flat trading, or what traders call a saw. If you see the price clearly moving sideways, you should pause trading and ignore the signal. Thank you for your attention, and good luck!
Download Forex Smart tools.

