
Folding Meter Strategy
Greetings dear visitors.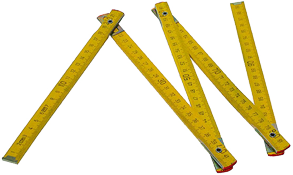 Many of you sooner or later come to the conclusion that searching for a trend reversal point is one of the best ways to make money on the stock exchange.
Another important fact is that finding the turning point in a timely manner will help you always exit the position on time without losing your own profit.
On various resources you can find various indicators, the main task of which is to search for such points.
But, unfortunately, as a rule, all these indicators give unprofitable signals that are in no way related to the price reversal.
Today I would like to introduce you to a well-known pattern called “Folding Meter”, which is based on technical analysis .
The author of this pattern claims that for each phase of the trend that I listed above, you should build your own trend lines. When you build three lines, you will get a pattern, the breakdown of which will be the basis for all trading. To begin, take any currency pair and draw a trend line along two extreme points.
If this is an upward trend movement, then the trend line is drawn along two minimums, and if this is a bearish price movement, then the line is drawn along two maximums. This way you can highlight the first phase of the trend movement. Further from the second extremum, along which the trend line was drawn for the first phase, draw another trend line with a new extremum.
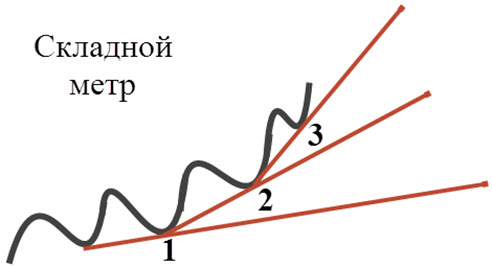
Thus, you will highlight the second phase of the trend movement. You must build the third trend line from the extreme point of the previous trend line (which indicated the second phase of the trend) to the new extreme. Thus, with the help of three trend lines you were able to indicate all three phases of the trend. You can see an example of how it should look in the picture below:
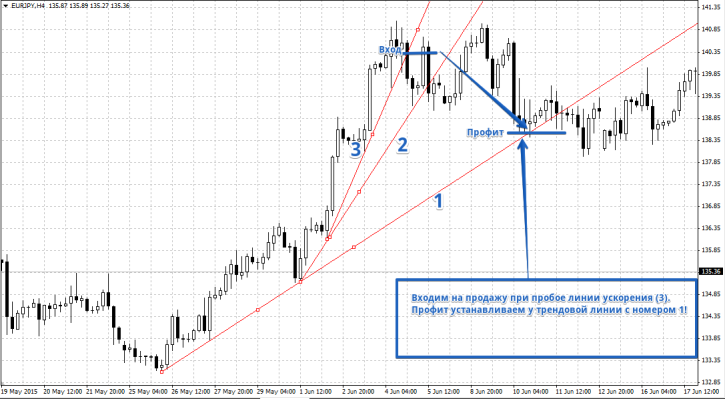
 And now, from building the pattern itself, let’s move on to trading signals , according to which we will actually enter the position. So, let's consider the bullish trend option. After you have marked all the lines on the chart, a signal for a price reversal is the breaking of the third line, or as we designated it “trend acceleration”. It is when the price breaks the third line during a bullish trend that we enter a sell position. You should set your profit at the level of the first trend line. You can see an example of entering a sell position in the picture below:
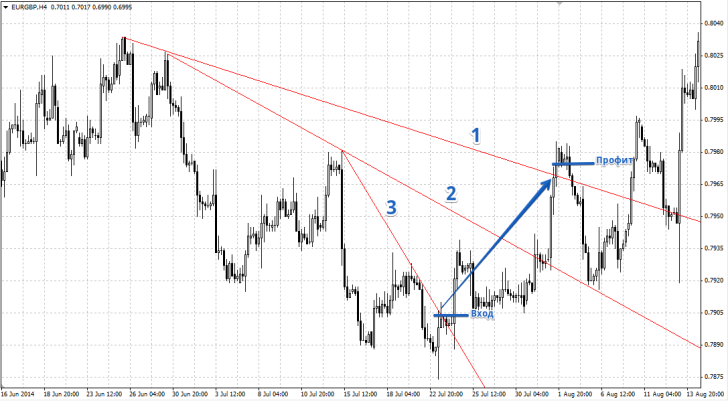
The conditions for entering a purchase are the same. Specifically, draw a Folding Meter pattern in a bear market and enter a position if the price crosses the third trend line. You should place your profit at the first trend line. You can see an example of entering a position in the picture below:
Stop orders must be placed near support or resistance levels, local minimums and maximums. Also, when searching for extremes, you may encounter some difficulties, which you can easily solve by adding the fractal indicator.
Despite the difficulties that arise when building this model, it almost always pays off. But I would like to note on my own behalf that this tool should not be taken as the main trading strategy, since most of the time you will be out of the market and miss the most important and profitable trend movement, making money only on pullbacks. Therefore, this pattern is suitable as a good addition to the main trading strategy. Thanks for your attention, good luck!