Japanese Candlestick Strategy – The Grail That People Don’t Want to Notice.
Every day, traders try to find new schemes for making a profit on the stock exchange, assuming that the secret lies precisely in them.
Various indicators,  Forex trading strategies, advisors, mathematical models, and simply intuition are not enough to trade successfully.
Sometimes new sophisticated methods just boggle the mind, and what's even scarier is that these would-be inventors create trading schools and try to teach you how to trade, not to mention the money and time you're wasting.
Having worked in the market for a long time and used a bunch of technical analysis methods, I realized one, but the most important and simple truth.
No indicator or trading strategy can give me more information about the state of the market than the price and its chart.
It doesn't matter what instruments you trade or what markets you trade—forex or stocks—only the price and its behavior on the chart provide the complete picture of what's happening. No indicator can tell you that the market is starting to run out of steam, that buyers are losing confidence and deciding to dump all their assets, or that a reversal is coming in a few points.
All indicators rely on historical data analysis, so you see a buy signal not at the moment it's just beginning, but when the new movement has already formed and traveled a certain distance.
For some reason, our psychology is such that we simply can't see the obvious and simple; we always want to complicate things, while pursuing the noble goal of getting a free lunch, which only comes in a mousetrap.
Think about how much money we lose by entering not at the bottom of a movement but in the middle? What stops do we set, and for some reason, as luck would have it, the price hits them? The answer is very simple: we don't view price as a source of information, but as a simple line moving up and down. To always understand the market situation and be aware of possible price changes, simply analyze Japanese candlesticks.
Numerous books have been written on various patterns and candlestick combinations, how they influence the market, and most importantly, why they form and what the crowd that suddenly wants to buy a particular asset is hinting at. You don't even need to buy any books; simply visit the "Japanese Candlesticks" section of our website and spend just a couple of hours studying the material presented. Now, to avoid being too blunt, let's look at some example patterns and compare indicator-based and candlestick-based entry points.
Japanese Candlestick Strategy in the Trading Terminal.
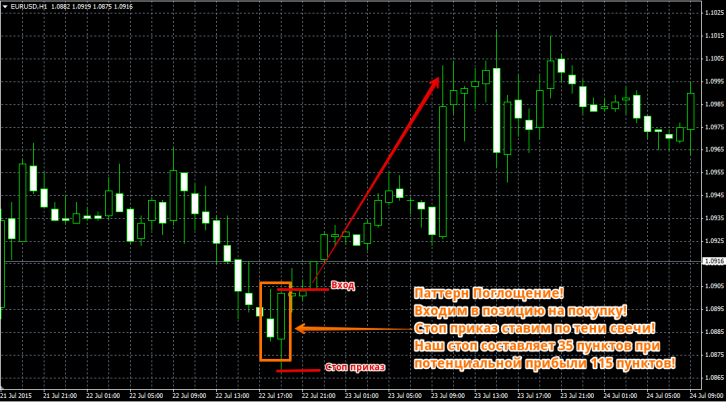
First, switch your chart to Japanese candlesticks. A very popular reversal pattern used by most experienced traders is the "Engulfing" pattern. It works by assuming that if the price is moving up and a candlestick appears in the opposite direction and is large enough to fit the previous one, this signals a market reversal. See the example image for a possible entry point:
Now let's consider the same situation, but if you were trading on a moving average breakout. The most popular moving average period, so actively used by traders, is 21. The type of moving average doesn't matter, the main thing is to look at an example of the same situation if you were entering based on the moving average:
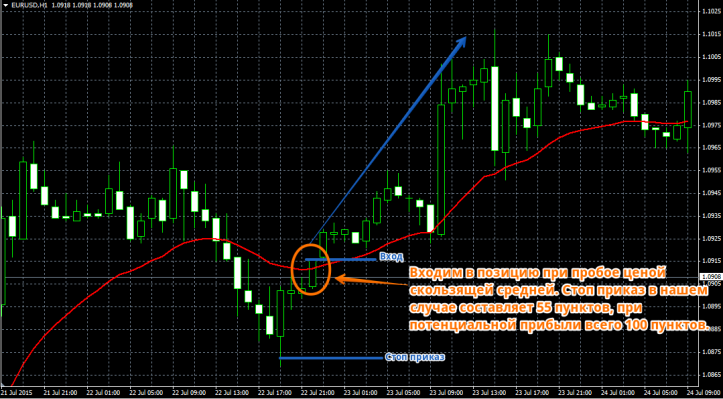
Comparing the two different approaches, if you had entered the market using the Engulfing pattern using the Japanese Candlestick strategy, your profit would have been 115 pips, with a risk of losing only 35 pips through a stop loss. In the second approach, you risk 55 pips through a stop loss, but only gain 100 pips.
Now, if you compare, you'll see that in the first scenario, you would have entered at the bottom of the movement, with a profit-to-stop ratio of 3 to 1, which simply justifies any risk. In the second scenario, however, the ratio isn't even 2 to 1, which calls into question whether it's worth entering the market with such a large stop order.
Now let's look at a common Doji pattern. I'm sure you've all seen this pattern when, during a price movement, a candlestick appears with virtually no body, just two tails. Market traders call it a "doubt candle." When it appears, we should understand that those players who were so eagerly buying or selling assets are beginning to doubt their actions and may try to exit their positions and dump everything back into the market.
Moreover, those who have worked with this pattern have noticed that it appears before news releases, which can signal a trend shift in advance. This pattern serves as a warning, so the appearance of a Doji should be your first warning sign of potential major market changes. This will always help you exit a trade promptly, without losing your hard-earned profits.
You can see an example of a Doji appearing and an exit strategy based on the appearance of an opposite signal on the moving average in the image below:
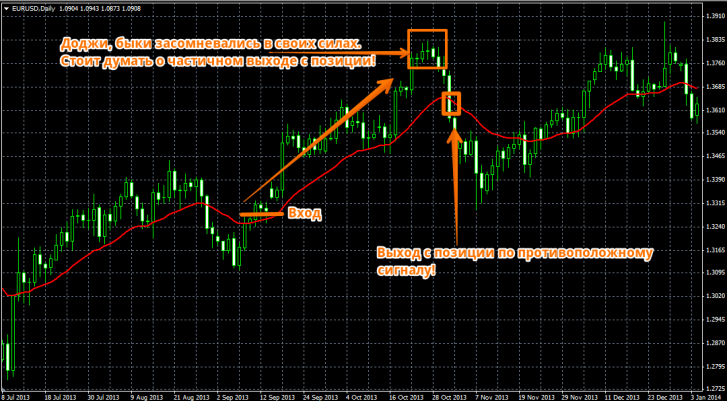
If we consider the example of exiting a position based on the Doji pattern and exiting based on the Reverse signal of the indicator, we can conclude that if we had taken the pattern into account, we would not have had to lose the 130 points of profit that we took from entering the trade.
In conclusion, I want to assure you that I'm not advocating that you trade solely based on candlestick analysis and nothing else. On the contrary, I strongly recommend developing your own trading strategy, but ignoring the clues a price chart provides is simply foolish and absurd.
The Japanese candlestick strategy allows you to gain a wealth of information using a standard currency pair chart, as there are various patterns and combinations that can both warn you of an impending market storm and provide excellent entry signals. Thank you for your attention, and good luck!

