3 Bar Buy/Low Set Up Trading Strategy
Traders often choose a single method of market analysis, whether it's indicators, candlestick analysis, volume, or other approaches. However,  experience shows that relying on a single type of analysis is insufficient, so most strategies consist of multiple indicators that attempt to compensate for each other's weaknesses.
In today's article, I'd like to share a combined Forex trading strategy that incorporates both indicators and Japanese candlestick analysis. While you won't see any complex patterns, you will learn how to build a unique, profitable trading system using a simple combination of candlesticks and a couple of standard indicators.
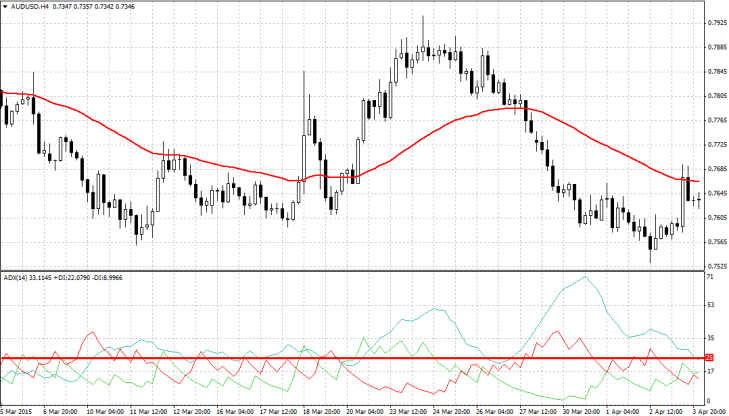
The 3 Bar Buy/Low Set Up trading strategy is based on two standard trend indicators: ADX with a period of 14 and a moving average with a period of 50. Before starting, select any time frame for any currency pair, but preferably from H1, and switch the chart type to candlestick.
You can trade any pair, so the choice of pair is yours. As you know, candlestick patterns and candlestick analysis remain relevant on any pair and on any time frame.
So, as I've already mentioned, the strategy is based on a simple candlestick pattern. However, first, we need to determine the current market trend. This is determined by a moving average. If the price is above the 50-period moving average, the trend is bullish; if it's below, the trend is bearish.
Next, if we've identified a trend, we need to wait for a candlestick pattern, which should consist of three candles opposite the trend. For example, if the trend is bullish, three consecutive bearish candles should appear.
If the trend is bearish, three consecutive bullish candles should appear. Simply put, you should see a pullback that forms three consecutive candles in the same direction. To confirm the signal, use the ADX indicator; its blue line should be above level 25. Pending orders. Now, here are the clear rules for entering each position.
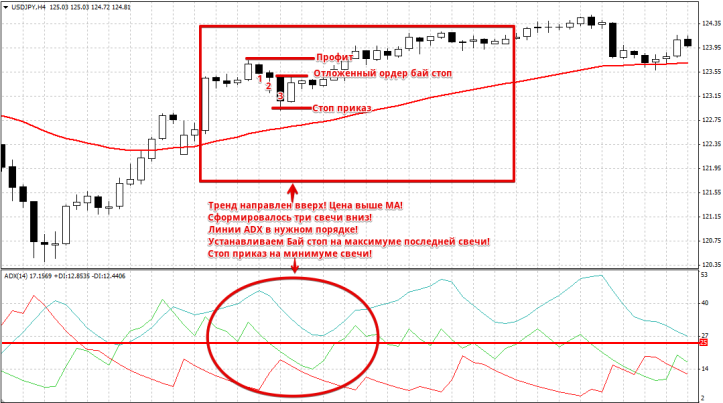
To place a pending buy stop order, the following conditions must be met:
1. The price is above the moving average.
2. A pullback has occurred and three consecutive bearish candles have formed.
3. Place a pending buy stop order at the top of the last bearish candle, and a stop order at the low of the same candle.
4. When the pattern appears, the blue line of the ADX indicator should be above level 25, and the green line should be above the red line.
We set the profit at the peak where the pullback began. For a better understanding, see the example in the image below:
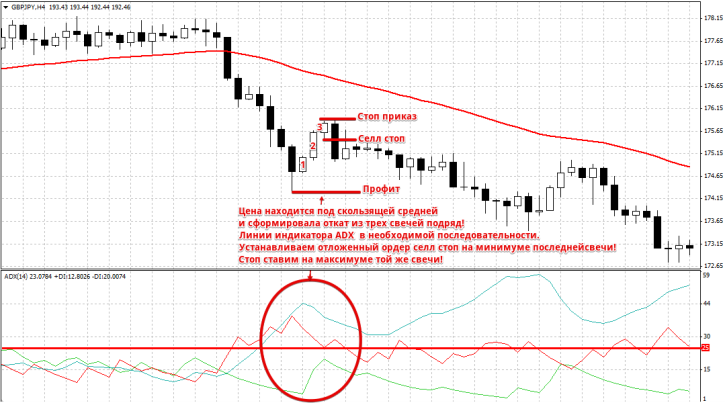
To place a pending sell stop order, the following conditions must be met:
1. The price is below the moving average.
2. A pullback has occurred, and three bullish candles have formed in a row.
3. Place a pending sell stop order at the low of the last bullish candle, and a stop order at the high of the same candle.
4. When the pattern appears, the blue line of the ADX indicator should be above level 25, and the green line should be below the red line.
We set the profit at the low where the pullback began. For a better understanding, see the example in the image below:
The strategy's signals occur extremely rarely, but most of them are usually profitable. You may also experience psychological difficulties when working with the strategy, as it's extremely difficult to find a downside entry when three consecutive rising candlesticks are in front of you, as it immediately suggests a trend reversal.
But you must understand that this is just a pullback that has temporarily deviated from the global trend. The entry rules for this strategy are very simple, but at the same time, I wouldn't recommend this strategy to beginners, as it's more aimed at experienced and mentally stable traders!

