
The “Traffic Light” trading strategy is a trading classic.
Greetings dear visitors. Today I would like to introduce you to one of the most popular trading strategies with which most beginners so enthusiastically begin their journey.
Traffic light is an indicator multicurrency trading system for trading on four-hour and daily charts.
There are a lot of modifications of this system on the network, since each trader begins to find some flaws and tries to patch these holes, but the framework and backbone of the strategy remains unchanged.
I have seen a lot of examples when “Traffic Light” is used on small time frames, but I cannot say that it is quite successful, since for scalping on a five-minute chart it is necessary to change the indicator settings.
Before you start, you need to install indicators and a template in your Meta Trader 4. To do this, download the archive with the template and indicators at the end of the article. Launch your trading terminal, go to the file tab and open the data directory of your terminal.
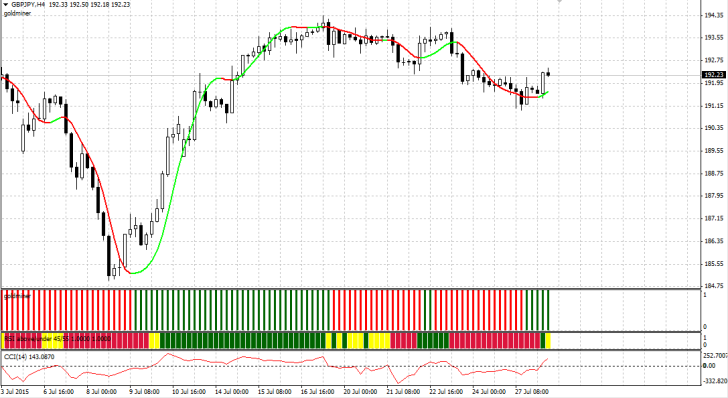
The indicators should be placed in the Indicators folder, and the template in the template folder, then restart the terminal. After launch, enter the templates and launch “Traffic Light”. If you installed all the files correctly, the terminal work area will look like this:
Despite the fact that the strategy is used by beginners, its author is clearly an experienced trader, since this is a completely balanced system that has both a signal indicator in the form of an oscillator and a trend indicator, which is responsible for the trend filter.
The system itself consists of four indicators, three of them are oscillators, and one is a trend indicator. Now let's briefly go through the indicators to understand what can be improved and what we should focus on.
Indicators for the Traffic Light strategy.
• HMA Color – appears as a red and green line on the graph. The indicator is a common modification of the moving average, so you can easily select and optimize the parameters by changing the indicator period as in the moving average. In the strategy, it is responsible for the trend filter. The green line is a bullish trend, the red line is a bearish trend.
• Goldminer – the indicator is located in the first additional window in the form of red and green bars. I don’t know exactly the basis of this tool, but you can also optimize the indicator period. In the strategy, the trend acts as a filter. If the bar is red, we enter only to sell, and if it is green, we enter only to buy.
• RSI Costume – the indicator is located in the second additional window in the form of red, yellow and green bars. This indicator is based on the well-known RSI oscillator. If you go into the indicator settings, you can change the period of the RSI indicator, as well as the levels based on which the bar color is based. The operating principle is as follows: The indicator line is above the level of 55, then a green bar is displayed, if the indicator line is below the level of 45, then the bar will be displayed in red, and if the indicator line is between 45 and 55, then the bar will be yellow.
• CCI is a standard oscillator that is present in your trading terminal by default.
You can optimize the indicator period. In the strategy, it is responsible for entering a position when crossing level 0. In general, all components of the strategy are considered, so if you decide to apply the strategy on lower time frames, you need to reduce the periods of the corresponding indicators.
Trading strategy signals Traffic light
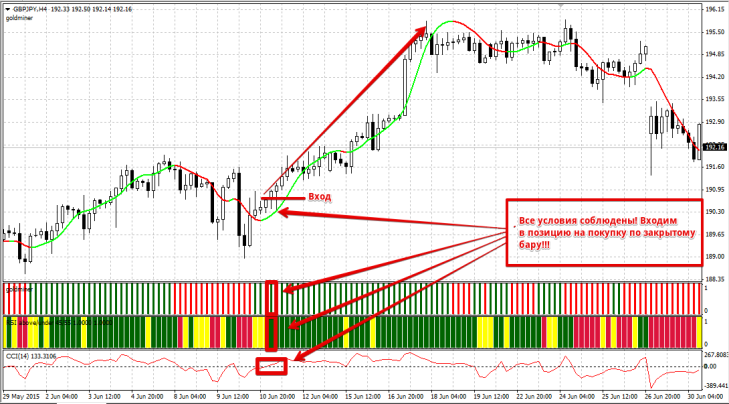
We enter a buy position if a number of the following conditions are met:
1. The HMA Color indicator line is green.
2. The Goldminer indicator bar is green.
3. The RSI Costume indicator bar is green.
4. The CCI indicator has crossed level 0 from bottom to top or is currently crossing.
We enter a position only on a closed bar, since the oscillators can be redrawn. An example of a purchase entry is shown in the picture below:
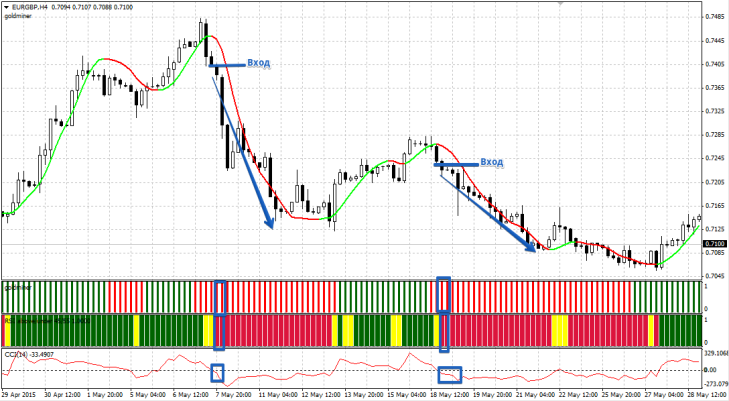
We enter a sell position if a number of the following conditions are met:
1. The HMA Color indicator line is red.
2. The Goldminer indicator bar is red.
3. The RSI Costume indicator bar is colored red.
4. The CCI indicator has crossed level 0 from top to bottom or is currently crossing.
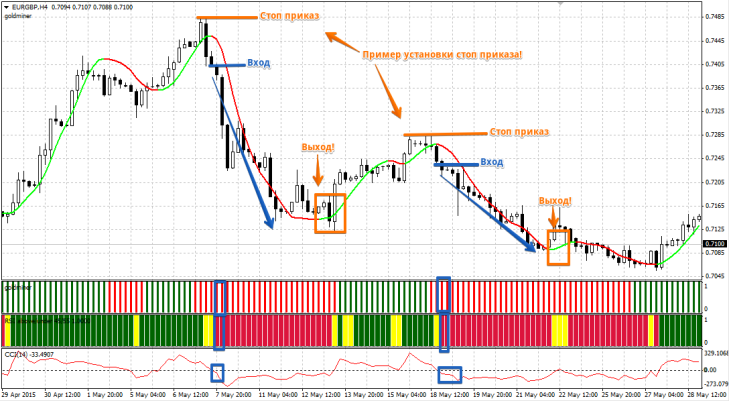
We enter a position only on a closed bar, since the oscillators can be redrawn. An example of a sell entry is shown in the picture below:
Exit from a position occurs when the HMA Color indicator line changes color to the opposite one. Stop orders must be placed at local lows and highs. If it’s difficult for you to find them, then just use some kind of level indicator or fractal. An example of exiting a position and setting a stop order can be seen in the picture below:
 Speaking for myself, the traffic light strategy has clear entry and exit points, as well as rules for setting stop orders.
The only thing that falls on you is the competent use of money management and the correct calculation of the lot. The strategy is easy to optimize, so it won’t be difficult to reconfigure it to suit your trading style. Download indicators for the strategy .