Fisher Trading Strategy
Strict adherence to a Forex trading strategy and money management rules are fundamental trading principles, without which no market participant has ever achieved success.

The Fisher trading strategy is one of the most common in trading on the foreign exchange market.
It is based on the well-known Fisher oscillator, which in turn has been used by traders for many years.
This indicator has always been the subject of much debate due to its tendency to redraw. However, if you've ever worked with any oscillator, you'll have noticed that its readings change as quickly as the price moves.
Therefore, this disadvantage is simultaneously an advantage, since your signals will always be relevant, and you will be able to clearly see any deviation from the indicator readings.
The Fisher trading strategy is designed for trading the EUR/USD currency pair, but you can apply it to any currency pair. This is because the strategy's components are technical indicators and are not tied to any specific currency pair.
The strategy can be used for scalping on a five-minute chart, as well as trading on higher timeframes. Therefore, I can confidently say that the strategy is multifunctional and multi-currency.
Before analyzing the signals, you need to install its components. To do this, download the archive containing the indicators and template at the end of this article. Next, use the File menu to access the trading terminal's data directory and place the indicators in a folder called indicators, and the template in a folder called template. Afterward, restart the trading terminal, go to Templates, and open the template called Fisher. The terminal's workspace should look like this:
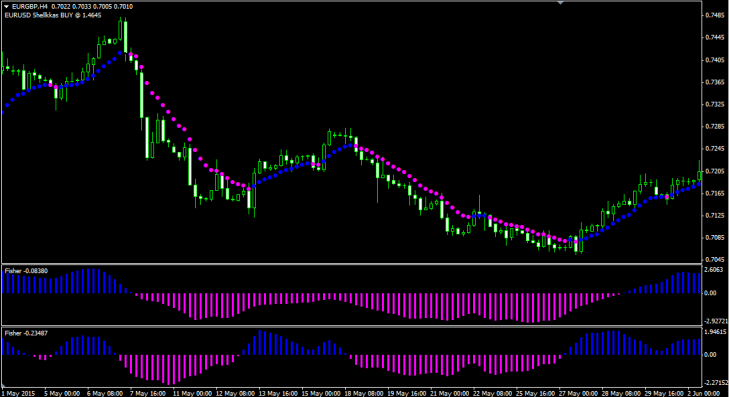
The trading strategy is based on two indicators: Fisher and Varmov. You can see the Fisher indicator in the first two additional windows as a blue and pink histogram. The strategy uses two Fishers with different periods, namely 55 and 10. This is necessary to visualize the current market picture and the broader trend. Thus, both indicators filter each other's signals, and the higher time frame is used for position exits.
The second indicator, Varmov, is a trend indicator based on a moving average and appears as blue and pink dots above and below the price. It's used in the strategy to filter trends. All indicator settings are open, giving you a wide range of options for optimizing the strategy to suit your trading style. The balance of the strategy's indicators is also visually visible, allowing you to filter out both trending movements and flats. Now, a brief overview of the trading strategy's signals.
Market entry signals using the Fisher strategy.
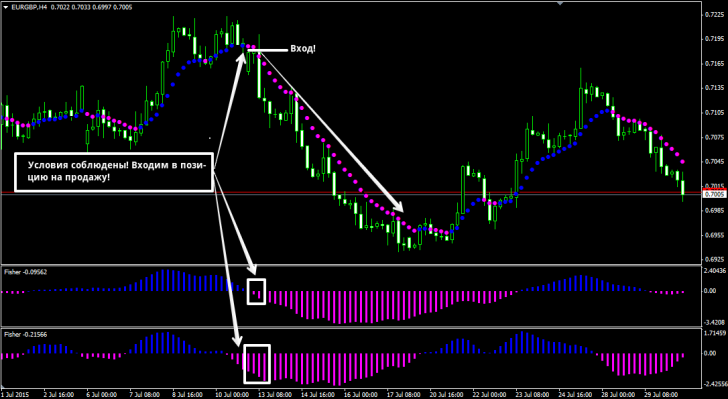
We enter a sell position when a number of the following signals are simultaneously met:
1. Varmov indicator draws a pink dot.
2. In the first additional window, Fisher is colored pink.
3. In the second additional window, Fisher is colored pink.
Note! The Fisher indicator repaints, so enter a position only on a closed bar! See the image below for an example of entering a sell position:
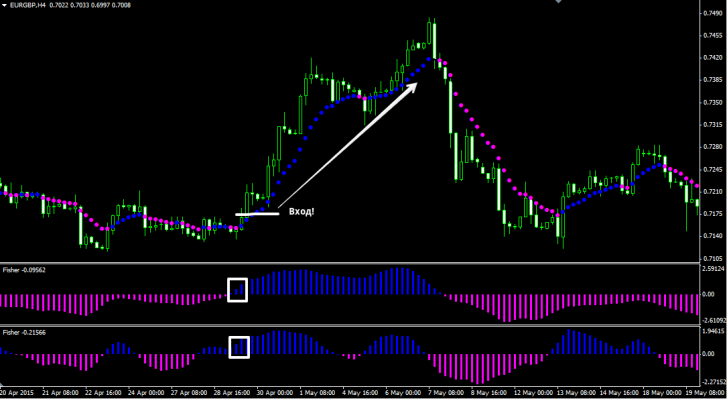
We enter a buy position when a number of the following signals are simultaneously met:
1. The Varmov indicator draws a blue dot.
2. In the first additional window, Fisher is colored blue.
3. In the second additional window, Fisher is colored blue.
Note! The Fisher indicator repaints, so enter a position only on a closed bar! See the image below for an example of entering a buy position:
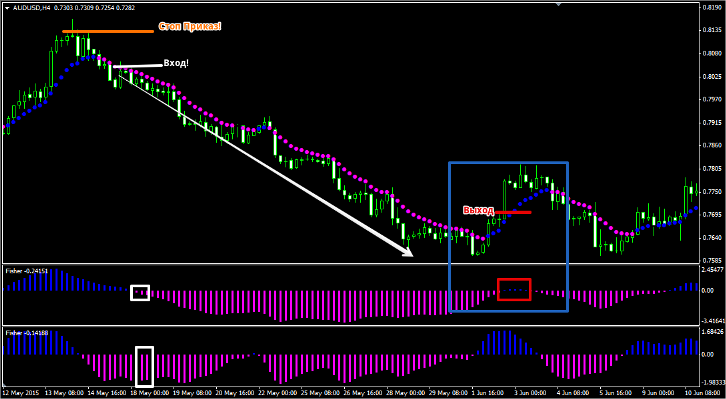
According to the strategy rules, you must exit your position when an opposite signal appears in the first additional window of the Fisher indicator. You can also exit your position if the Varmov indicator point changes to the opposite of the main signal.
Stop orders should be placed near local highs and lows. If you have difficulty finding these levels, you can use the Parabolic or Fractal indicator. An example of a stop order placement and exit point can be seen in the image below:
Considering the strategy's advantages, it's worth noting that it has clear rules for entering and exiting positions, as well as setting stop orders. Importantly, the strategy consists of only two indicators, yet retains its profitability and functionality. So, you have an excellent framework on which to build your own trading strategy.
Download the necessary tools for the Fisher strategy

