Parabolic trading strategy on moving averages.
Using the Parabolic Sar indicator in any Forex trading strategy always solves many problems that often  arise when developing your own trading system.
Indeed, it's not for nothing that many traders call the Parabolic indicator a trend guide, because using it you will never go against the market, and you will also have fewer problems with setting stop orders.
Thanks to its versatility and functionality, it's used in various trading strategies and expert advisors. I'll introduce you to one such trading strategy today.
The Parabolic Moving Average trading strategy is a trend-following strategy based on standard technical indicators from the Meta Trader 4 trading platform. This system is used on the EUR/USD, GBP/USD, and the beloved gold currency pair.
Since the strategy consists of standard indicators, there's no need to install any third-party files other than the template. In your terminal, go to the indicators section and plot three exponential moving averages of different colors with periods of 10, 25, and 50.
You also need to apply the Parabolic SAR and MACD with their default settings. If you're too lazy to do this, you can install the template in the Template folder, then select "Parabolic on Moving Averages" from your template list. After running the template (you can download it at the end of the article), your chart will look like this:
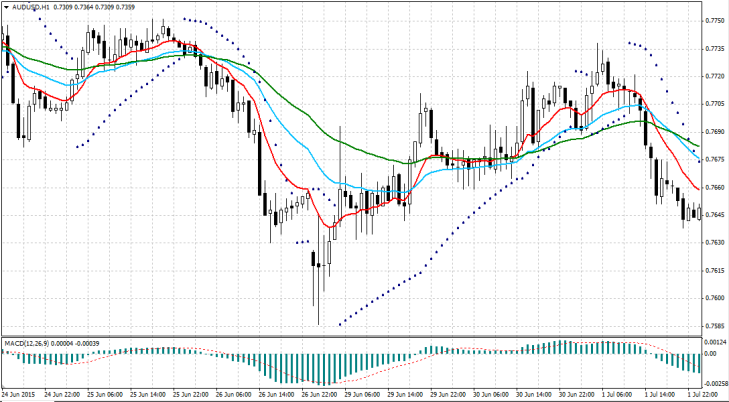
The core of this strategy is three standard indicators: Parabolic SAR, MACD, and Moving Average. Essentially, we have a fully balanced trading strategy based on two trend indicators and one oscillator. The three moving averages serve as signals, triggering entry signals when they cross. MACD and Parabolic SAR act as trend filters and stop-loss orders. Now, let's move from the strategy's core to its signals.
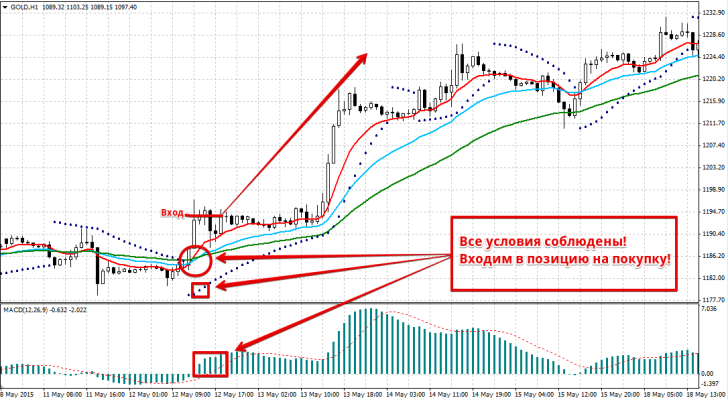
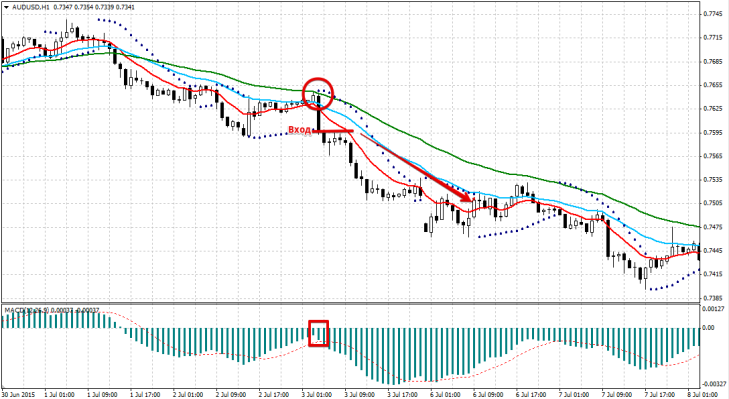
We enter a buy position when the following conditions are met simultaneously:
1. The 10-period moving average intersects the 25- and 50-period moving averages from bottom to top. (The red line intersects the blue and green lines from bottom to top).
2. The Parabolic indicator point is below the price.
3. The MACD indicator histogram is above level 0.
Position entry occurs strictly on a closed bar. An example of a position entry is shown in the image below:
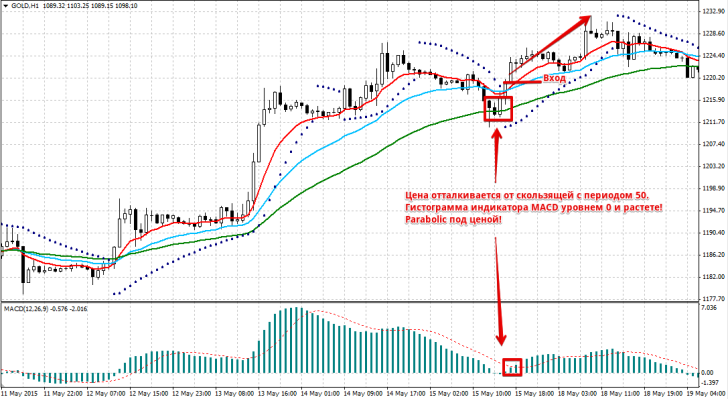
If you missed the main signal or just want to add to a buy position, an additional signal occurs when:
1. The price approached the 50-period moving average and bounced off it.
2. The MACD indicator is above level 0, and its bars are growing (the current histogram bar is higher than the previous one).
3. The Parabolic indicator point is below the price.
An example of adding to a buy trend is shown in the image below:
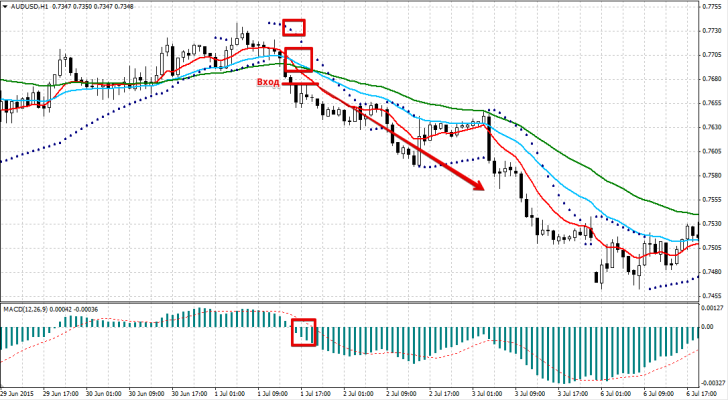
We enter a sell position when the following conditions are met simultaneously:
1. The 10-period moving average intersects the 25- and 50-period moving averages from top to bottom. (The red line intersects the blue and green lines from top to bottom).
2. The Parabolic indicator point is above the price.
3. The MACD indicator histogram is below level 0.
Position entry occurs strictly on a closed bar. An example of entering a sell position is shown in the image below:
If you missed the main signal or simply want to add to a sell position, an additional signal occurs when:
1. The price approached the 50-period moving average and bounced off it.
2. The MACD indicator is below level 0, and its bars are falling (the current histogram bar is lower than the previous one).
3. The Parabolic indicator point is above the price.
An example of adding to a buy trend is shown in the image below:
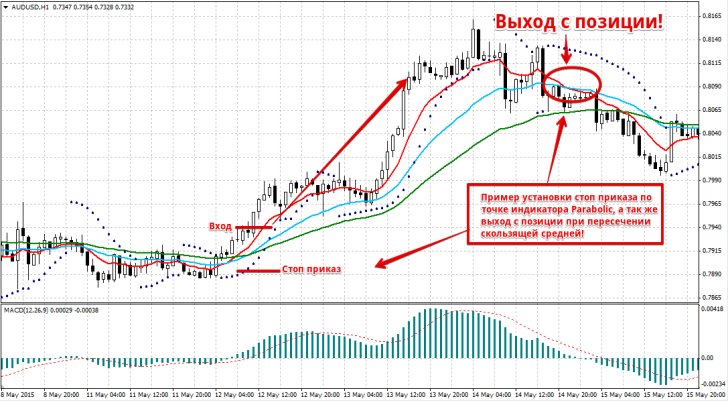
Proper risk management and a well-placed stop order are no less important than the entry point itself. In this strategy, the stop order should be placed at the point on the Parabolic indicator that is above the candlestick you enter the position on.
You can also set your stop order at local highs and lows. A buy position is exited if the 10-period moving average crosses the 25-period moving average downwards. A sell position is exited if the 10-period moving average crosses the 25-period moving average upwards. The profit is typically set at twice the stop loss, but as the price moves, the stop loss moves along the parabolic points, so the profit loss must be moved higher. See the image below for an example:
In conclusion, I can say that this isn't just a trading strategy, but a system with entry rules for both primary and secondary signals. Any trend-following strategy has a vulnerability— flat trading—but a single profitable position can close at least two stop-loss orders.

