macd indicator, description and settings
The MACD indicator, time-tested and used by many professional traders, allows for quite effective Forex trading.
Its new version has become even more accurate and functional; it analyzes the trend based on the current situation, taking into account historical data, which makes its use even more justified and effective.
The visual display of received data has been improved, and new operating parameters have been added.
To improve performance, the indicator window now displays two new levels. These levels allow you to avoid false signals and open trades only at the most opportune moments.
A moving average was also added, which accurately conveys the underlying Forex trend. It is displayed as a blue curved line.
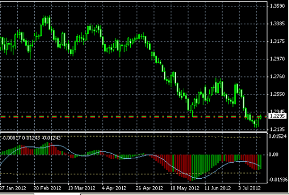
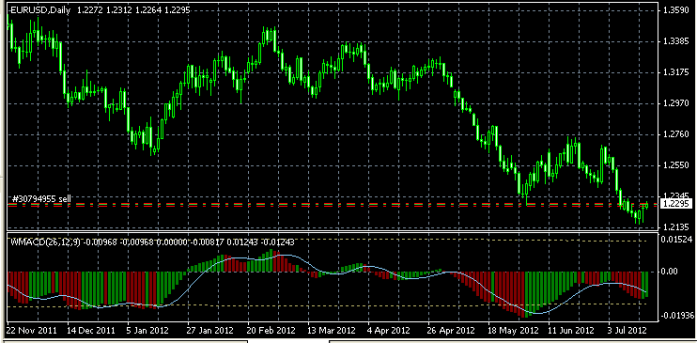
After adding a currency pair to the chart, you will see the following image:
Setting up the macd indicator
The main settings of this tool concern the specific period selected for trading and the features of the moving average calculation.
You will find a more detailed description of them in the archive after you download the macd indicator.
The script's operation is displayed in a separate window and does not interfere with the currency pair's chart. Key indicators are presented as a histogram, allowing you to assess not only the trend direction but also analyze its additional properties.
During testing, the MACD histogram indicator showed quite good results, with over 70% of trades being profitable, which characterizes its performance only from a positive side.
Trading strategy using the MACD indicator.
The basic strategy for trading this instrument is simple trading in the direction of the prevailing trend. Your task is to determine the most favorable entry point and forecast future price movements.
The MACD histogram indicator allows you to determine the most successful entry points into the market, usually these are the places where the length and color of the indicator bars change, and the moving average line serves as an additional reference point.
A change in the direction of the main trend of the exchange rate can be observed by the movement of the histogram itself below or above the zero line; the colors of the bars serve as an additional reference point.
Green color – there is an upward trend on the market – buy transactions.
Red color – the price of the currency pair is decreasing – sell transactions.

