New ATR indicator
The well-known ATR indicator has undergone significant changes. It is now combined with the MACD indicator for greater clarity.
By combining the scripts, all standard functions were retained and new features were added, making the new program even more functional and efficient.
Essentially, a new technical tool has emerged that combines the useful properties of long-known Forex scripts.
Now, after installing it on your trading platform, you can see not only the familiar curve, but also a multi-colored MACD histogram.
This approach allows for a comprehensive trend analysis and the timely identification of all possible trends in the Forex market.
Also, now there will be no need to place two indicators of the same name on the chart.
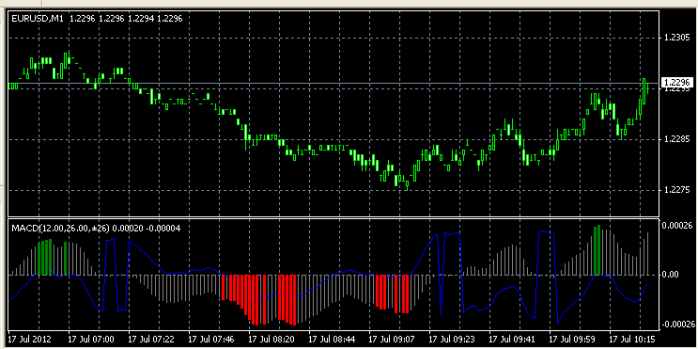
If you used the standard settings that the indicator already has by default during installation, it will appear below the currency pair chart in a separate window.
Setting up the indicator
The script has a number of simple settings that can be used to achieve the desired result, but you can also leave the default settings if desired.
FastEMA is the fast EMA of the MACD indicator;
SlowEMA – slow EMA of the MACD indicator;
ATR – trading range period;
Price – the price at which the MACD indicator will be calculated:
0 — close,
1 — open,
2 — high,
3 — low,
4 — median (HL/2),
5 — typical (HLC/3),
6 — weighted (HLCC/4).
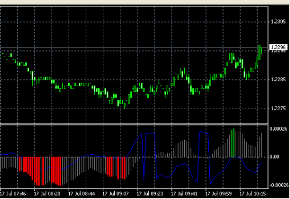
The blue line of the iMACD ATR indicator is the result of shifting the MACD by the ATR value. When the signs of the MACD itself match the result of its shift, the histogram bars are colored.
But in order for two or more columns in a row to be colored at once, the MACD histogram values must constantly increase for positive values, and constantly decrease for negative values.
Strategy for using the ATR indicator
The ATR indicator displays the received data as a blue curve, moving around a reference axis, which is zero by default. If the market is in an uptrend, the line moves upward, and vice versa.
Be careful, however, as it also reacts to small price rollbacks, so it is possible to receive false signals that should be filtered using the second component of the program.
The MACD indicator performs an auxiliary function and serves as an excellent filter for received signals; with its help, you can confirm or refute the data received from the ATR.
It is also tied to the coordinate axis and reacts to changes in trend, moving from one plane to another.
An upward trend is when the histogram is above the axis and the length of its bars increases.
Downward trend – the histogram is below the axis and an increase in the bars is also noted.
When the movement weakens, you can observe a reduction in the length of the MACD indicator bars; in this case, a quick reversal of the price movement is possible.
When areas of a strong trend emerge, the bars are colored green or red depending on which direction the price is moving; in fact, this indicator characterizes the strength of the existing trend.
After observing this indicator for just a few minutes, you'll be able to independently determine the most favorable entry points into the market. The trade will be closed if the movement weakens and there are the first signs of an imminent reversal.

