Automatic Linear Regression Construction
A simple yet effective indicator, Linear Regression, allows for automatic construction of a linear regression channel.
It automatically finds the necessary levels, and all you have to do is decide to open an order that defines the channel boundaries.
When testing the operation and installation of this script, no problems were found; the program is completely ready for use and can work even with default settings.
Construction is carried out based on the specified parameters, at your discretion; you independently set the channel width and timeframes.
The program perfectly identifies all significant minimum and maximum points on the time period you select.
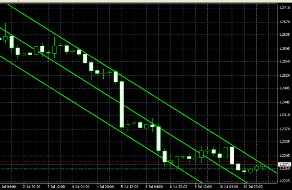
After installation in the trading terminal, three defining lines will appear on your chart, two of which define the boundaries of the constructed channel, and the third will determine the direction of the main trend.
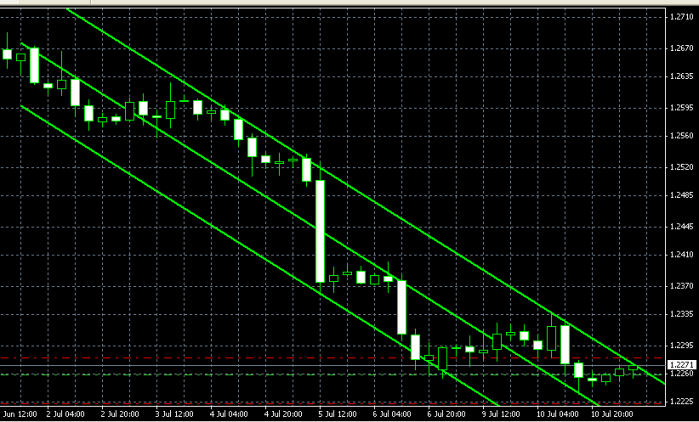
If necessary, you should change the display color of the lines, since by default one of them may be displayed in black and will blend in with the background of the trading terminal.
If you use a pending order trading strategy, a special mark will help you determine the desired price level, at which you should place an order to break out of the channel.
Setting up Linear Regression parameters.
In essence, this is a fairly simple tool; to ensure it works correctly, you only need to configure the following parameters:
FixedDateTime – the indicator that will determine the channel width. We set the starting date from which data is taken into account. When entering the date, consider the working time frame. For example, if trading is conducted on a 15-minute timeframe, then data for just one day is sufficient.
STOP Color – the color in which the price target for the breakout will be displayed.
Trend Line Color – the color of the channel borders, green by default.
LR WIDTH – thickness of the linear regression lines.
These are all the parameters required for work; after entering them, you can launch the program.
Trading strategy.
When using the Linear Regression indicator, you can use two well-known strategies: breakout or reversal.
For a breakout , this is based on the use of pending orders, which are placed slightly beyond the price mark in the direction of the expected trend movement. Don't forget to set a stop loss, as breakouts can also be false.
On the reversal - by analyzing the trend movement within the channel boundaries, the price change dynamics are clearly visible; based on this, we open trades during an upward trend at the lower boundary of the channel, and during a downward trend at the upper boundary.
Following the trend , a trade is opened as with a reversal strategy, but the position itself is held for a longer period of time. It is important to consider the stability of your deposit to price fluctuations.
Linear Regression is a simple and convenient tool for constructing linear regression lines, significantly increasing the efficiency of technical analysis.

