Parabolic SAR indicator
Most traders often find themselves in a situation where they don't know where to exit the market or place a stop loss. While  entering a position correctly is certainly a good idea, exiting it correctly without doing so too early, or as they say, when it's too late (a new reversal takes away all the profit), is one of the most difficult challenges every trader faces.
Welles Wilder once faced this same challenge, and his solution resulted in his new Parabolic SAR indicator. The indicator was introduced to traders in 1976 in the author's new book, "New Concepts in Technical Trading Systems.".
At that time, this book became a real boom in the trading industry, so most beginners start their journey with it.
If you translate the abbreviation SAR literally, you can understand the whole essence of the indicator, since its translation sounds like this: “Stop and Reverse”.
This indicator is so popular that all trading platform developers, without exception, include it by default. To add the indicator to a price chart in the Meta Trader 4 platform, go to the navigator panel, open the list of indicators, and then the trend subsection. Then, simply drag the indicator onto the price chart. If you've done everything correctly, your chart should look something like this:
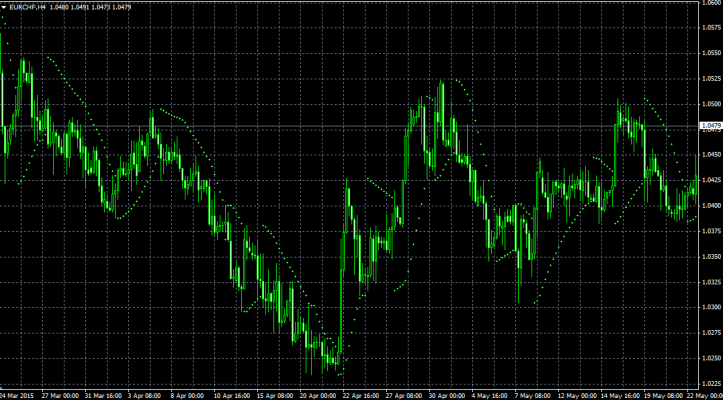
As you may have noticed, the tool is displayed as dots above and below the price. The indicator's calculation formula is very complex, so I won't go into detail about it, but I can say that in addition to price, the indicator also takes time into account. If you look closely at the chart, you'll notice that the dots in different sections are spaced at different distances from the price. These distances are the result of incorporating the time parameter into the calculation formula, allowing the indicator to show a kind of trend aging.
If the trend is young and has just started, the dots will be located at a large distance, and as the trend ages, they will move closer and closer to the price.
Features of using Parabolic SAR
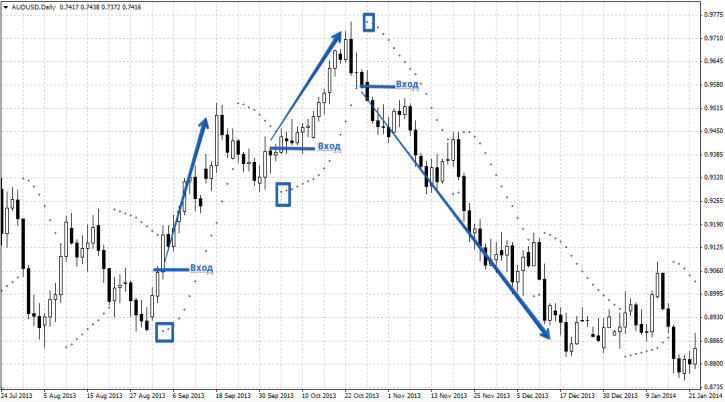
Traders very rarely use this indicator for position entry. However, there are scalpers among them who would be indispensable without it. For example, you can enter a buy position if a dot appears below the price, or enter a sell position when a dot appears above the price. However, this is a very rare use of the indicator. If it is used, they try to enter when the second dot appears, to avoid considering it a weak market momentum. You can see an example of an entry in the image below:
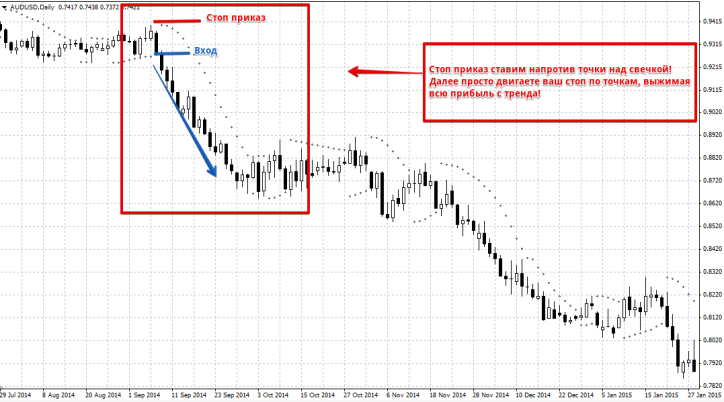
Although some traders use this indicator for entering a position, its main purpose is to help exit a position and set a stop loss. Let's say you've entered the market, it doesn't matter whether you place your stop loss on a buy or sell trade. Many people will start singing the praises of support and resistance, but what if it's far away? The Parabolic indicator can help with this. A stop loss is placed at the dot it draws, and then the stop loss is moved along the dots in the direction of the price. An example is shown in the image below:
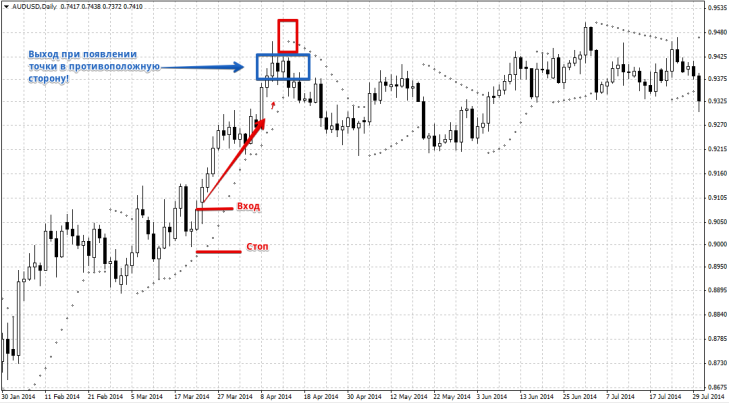
If you're considering exiting the market, the Parabolic SAR indicator dot can also help. If you're in the market and a dot appears in the opposite direction, it's a good time to exit. You can see an example below:
The Parabolic SAR indicator is actively used as a trend filter. For example, only buy if the indicator dot is below the price, and only sell if the dot is below the price. Overall, this is a very useful tool that many traders underestimate, which is a shame, as it can help answer many questions! It's a good combination to use with a tool like the Trend Direction Indicator

