
Trend continuation patterns
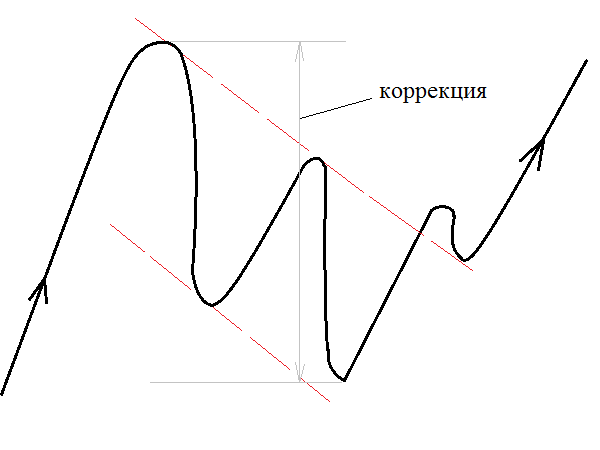
Often we are faced with a situation when the price began to roll back from the main trend with renewed vigor.
At this moment, you are faced with the eternal question: will the price go further in a new direction and the trend is over, or will the price return to the direction of the trend after a minor pullback? Traders face this situation every day and many, unfortunately, make serious mistakes, entering a position in the hope that it is at the source of a new trend or, conversely, in the hope that now there is a pullback, we hold our positions until the profit is completely reset .
Today I would like to introduce you to two of the most common trend continuation patterns that will help you predict the further development of the trend with a high probability.
Almost all traders are familiar with various trend reversal patterns, because the long-standing dream of entering at the bottom always haunts a stockbroker, but only true pros know that they should not chase a reversal, but rather look for strong trends and opportunities to enter using them.
The first most famous trend continuation figure is the Flag.
It is formed after a sharp price impulse, and then there is a systematic rollback. Moreover, the rollback occurs purposefully against the main price movement. In order to indicate this figure on the chart, the pullback should move evenly, while on both sides along the price highs and lows, you could draw two lines parallel to each other, as is done when constructing a channel.
The stock to the flag is the sharp impulse of the main trend, which preceded the rollback. You can see an example of a Flag trend continuation pattern in the picture below:
 There is a flag for both bullish and bearish trends.
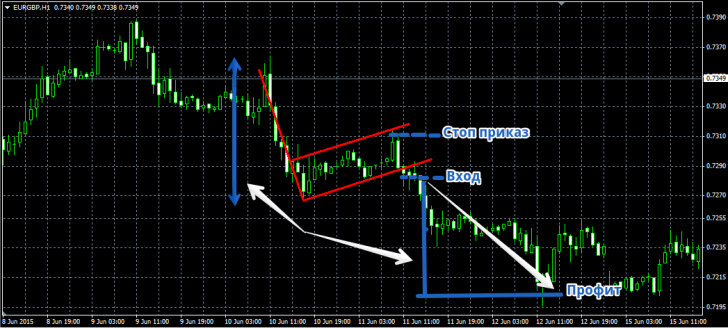
Now how do you actually trade using this pattern? If you see that there is a flag in front of you in a bullish market, then the signal to enter a buy is the breaking of the upper resistance line. The profit is set by the size of the previous impulse, and the stop order is set at the nearest local minimum. A sell signal occurs if a flag has formed in a bearish trend and the price has broken through the lower resistance line. The stop order is set at the local maximum, and the profit is equal to the previous price impulse. You can see an example of entering a position using a flag pattern in the picture below:
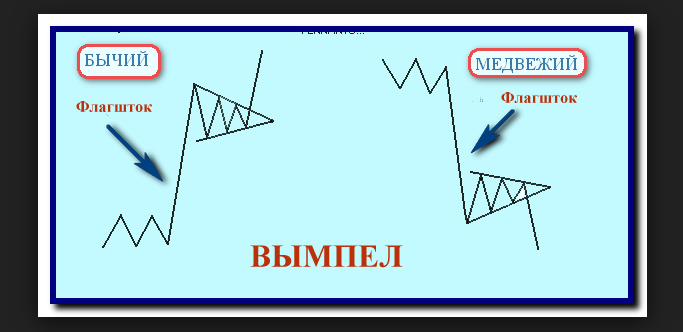
The second well-known trend continuation figure is the Pennant. The pennant is formed according to the same principles as the flag figure after a sharp surge in price and the formation of a rollback. However, the pullback forms a symmetrical tapering triangle instead of two parallel lines. You can see an example of the Pennant pattern in the picture below:
 Signals to enter a position are practically no different from trading using the Flag.
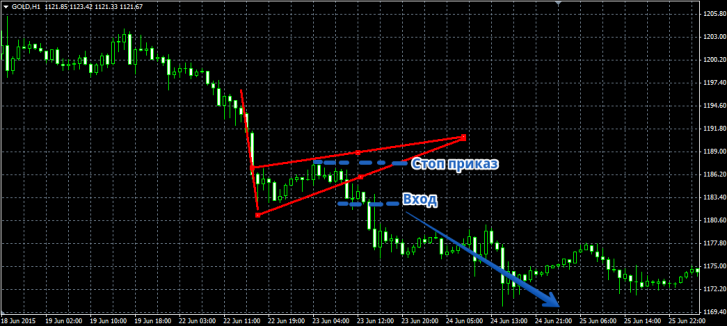
If in front of you in a bull market, after a price surge and a pullback that has appeared, you see a Pennant, then the signal to enter the position will be a breakout of the upper trend line. Moreover, the entry occurs only after the candle closes and is outside the triangle.
We set the stop order at the nearest local minimum, and set the profit with the size of the previous surge or, as shown in the picture, with the size of the flagpole. A sell signal appears if a Pennant has formed in front of you on a bearish trend, and we enter the position after breaking through the lower trend line and consolidating outside the triangle. We place a stop order at the nearest local maximum, and the profit is equal to the length of the previous surge (flagpole). You can see an example of entering a position in the picture below:
 Many, probably, who have at least once been interested in trend continuation patterns, noticed that I did not mention the Triangle figure.
The fact is that most people mistakenly believe that this is also a trend continuation figure, but in practice the Triangle can be called a figure of doubt, since which of the borders of the triangle the price will break through in that direction, as a rule, it is directed, so breaks can also occur against the main one trend like reversal patterns.
Therefore, when you see a triangle, be prepared that the price may behave extremely unexpectedly. In conclusion, I would like to say that the Pennant and Flag patterns are extremely common in everyday trading, so you should carefully consider the chart and react accordingly to their signals.