
Pivot points

Many traders perceive these tips as the purely personal opinion of an expert who bases his calculations solely on his strategy.
However, almost all of these analysts use fairly simple formulas to calculate turning points, and most of their forecasts are of the same type.
Are you doing technical analysis on Forex and don't know how to calculate turning points?
After reading this article, you will no longer have problems finding these levels.
Calculation of turning points at five levels
First, you need to calculate the central turning point using the formula: MDG = (Previous day's high + previous day's minimum + day's closing price)/3.
To consolidate this formula, I propose to calculate the central turning point for euro/dollar pairs = (1,1392+1,1325+1,1353)/3 = 1.1356.
Next, we calculate the first support using the formula: (Central turning point *2) - the maximum of the previous day.
For the euro dollar this value looks like this: S1 = (1.1356*2)-1.1392 = 1.1320.
We calculate the first resistance level using the formula: R1= (Central pivot point *2) – the minimum of the previous day. For the euro dollar currency pair R1=(1.1356*2)-1.1325= 1.1387.
Once you have calculated the center line and the first support and resistance, you can calculate the second support and resistance, which will give you a total of five turning points.
The second support level is calculated using the formula: S2= Central reversal line + (Resistance level 1(R1) – Support level 1(S1)). For the euro/dollar currency pair S2 = 1.1356+(1.1387-1.1320)=1.1423.
The second resistance level is calculated using the following formula: R2 = Central reversal line - (Resistance level 1 (R1) – Support level 1 (S1)).
For euro/dollar this value is as follows: R2=1.1356-(1.1387-1.1320)=1.1289. After we have calculated all five points, we plot them on the graph with horizontal lines.
The result for euro/dollar is shown below:
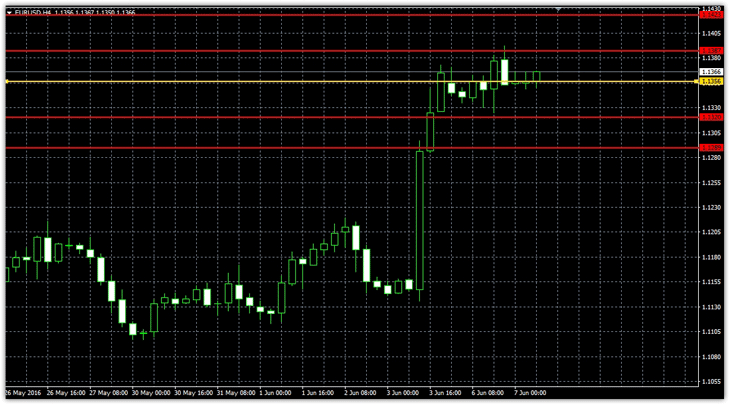
There is also a formula that complicates the calculation of these turning points.
Thus, the calculation of the first and second levels of support and resistance remains the same, but the formula for the basic calculation of the Central Pivot Point changes and it looks like this: (Today's opening price + minimum + maximum + closing price)/4. The opening price in the forex market is the closing price of the previous day.
Turning points according to Demark
In addition to the option discussed above for calculating turning points, there are dozens of other methods and approaches, but the most popular alternative is the method proposed by Thomas DeMark.
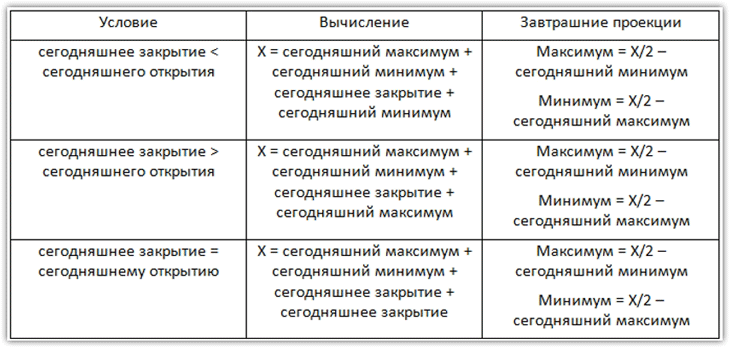
The essence of the method lies not in the banal calculation of the formula, but in the fulfillment of a certain condition in the market, namely the ratio of the closing price and opening price relative to each other.
In order not to describe a dozen formulas, I suggest you get acquainted with the system for calculating turning points from Demark in the table below:
Application of turning points in practice
Turning points have this name for a reason, but because reversals quite often occur near them.
Essentially, turning points are support and resistance levels and are traded in a similar way. An example of behavior in the formed range from the reversal levels that we calculated for the euro/dollar currency pair:
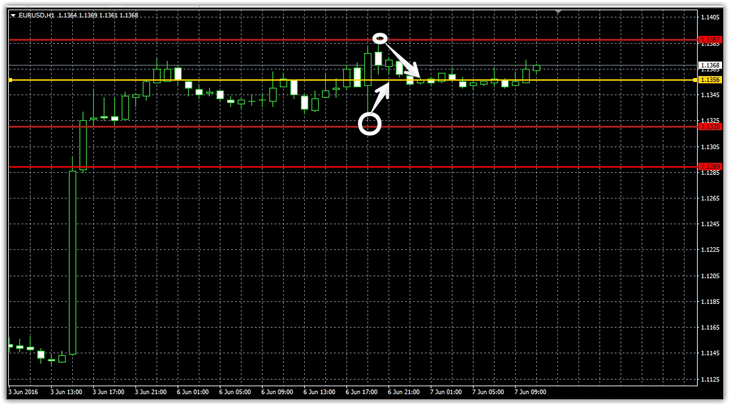
When using turning points, as a rule, they are usually traded for a breakout or rebound.
The middle line, as a rule, acts as a filter of the main direction of the trend, namely, if the price is above this line, then the market is upward, and if the price is lower, then the market is downward. In addition to direct signals for entering the market, turning points give the trader an idea of the possible development of events, namely where the price will go after breaking through a certain level and where braking may occur.
Thus, turning points allow you to correctly determine the targets and places to place stop orders .
It is also worth noting that turning points are calculated every day, so at the end of the day you need to delete all the levels you have drawn and calculate new ones using the newly generated data. In general, there is nothing complicated in finding and calculating turning points, but today there is no point in going through a daily routine, since there are dozens of different indicators that implement these formulas and display support and resistance levels.