
Best channel indicator, comparison, review and basic settings
The price, as trivial as it may sound, follows certain patterns in its movement.
It is no secret that the wave theory, like many others, is based precisely on observations, but one of the most important patterns is the channel price movement.
You may ask, how does this pattern manifest itself?
I think it’s no secret to you that the price almost never moves only up or down. No matter what chart you open, you will always see various pullbacks and meandering charts. The thing is that, according to many theories, the price always tends to balance after strong fluctuations in different directions.
During these fluctuations, the channels that technical analysis so often uses are formed.
To simplify the construction process, as well as to apply special mathematical approaches, traders use so-called channel indicators, which carry out automatic construction. There are various approaches to construction, ranging from complex mathematical ones to simple methods based on several reference points.
The most popular channel indicators
Actually, in this article you can get acquainted with the most popular channel indicators, as well as download and apply them in your own trading.
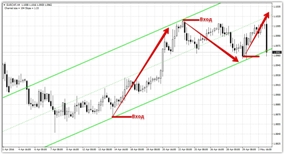
SHI Channel.
The SHI Channel indicator automatically builds the so-called Borishpolts channel.
The construction of this tool is based on the Bill Williams fractal, which consists of five candles, namely one central main one and two side ones.
To build a channel, the indicator catches the last two fractals and builds a line based on them.
Then, having caught the opposite third fractal, a second equidistant line is built. When trading, two classic techniques are used, namely trading on a rebound from the channel boundaries with a minimum target to the middle line or a breakdown of existing boundaries.
When a breakout occurs, the instrument makes a mark, symbolizing the signal on the chart.

In the indicator settings in the BarsForFrac line, you can change the size of the fractal that is taken for calculation.
So everyone knows that a fractal consists of five candles, so if you specify a parameter greater than five you will get stronger points, but with a very delayed effect. The ALLBARS line indicates the number of candles on which the channel will be built.
Keltner Channel Channel
indicator - the Keltner channel is one of the most popular technical analysis tools, which displays a kind of channel around the price, which consists of three lines.
Unlike the previous tool, the basic basis for constructing the indicator is not reference points, but a mathematical approach through a moving average. In the settings you can change the moving period. Keltner Channel is 90 percent similar to Bollinger Bands and is based on volatility parameters.
When using the Keltner Channel, you need to clearly understand that when scalping on small time frames, it is customary to consider signals for a rebound from price boundaries, and when trend trading on senior charts, signals for a breakout of the channel are taken into account.

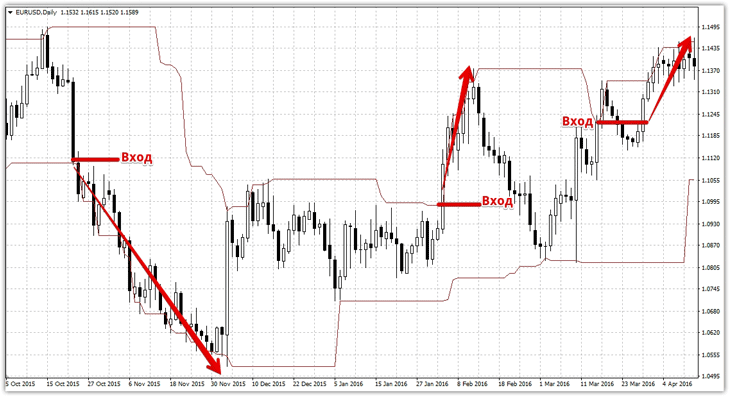
Donchian Channel.
The channel indicator - Donchian Channel was developed back in the seventies by Richard Donchian.
The principle of constructing and using the tool is quite simple. This is how the indicator finds the minimums and maximums of the price for a certain period of candles, by default it is 20. Having constructed these values as a channel, the process of interpreting signals comes down to breaking through these extreme values with new goals.
The tool was designed for trend trading on large time frames, and best of all on daily charts. If you use a script for scalping , then you should consider signals for a rebound from price boundaries, and when working on the continuation of a trend, signals for a breakout of one of the boundaries are considered.
In the indicator settings there is only one period, which indicates the number of working days in a month.
This parameter is relevant only for trading on the daily chart, so before using the indicator on other time frames, we recommend reconfiguring the instrument. LinRegression Breakout.
The LinRegression Breakout tool independently not only identifies a channel from two lines, but also gives signals for a breakout of its boundaries.
With simple up or down arrow signals, LinRegression Breakout is an interesting tool for every beginner. When the indicator crosses one of the borders, an arrow indicates the direction of the transaction, a cross indicates the place of the stop order, and an arrow directed horizontally indicates the place of your profit.
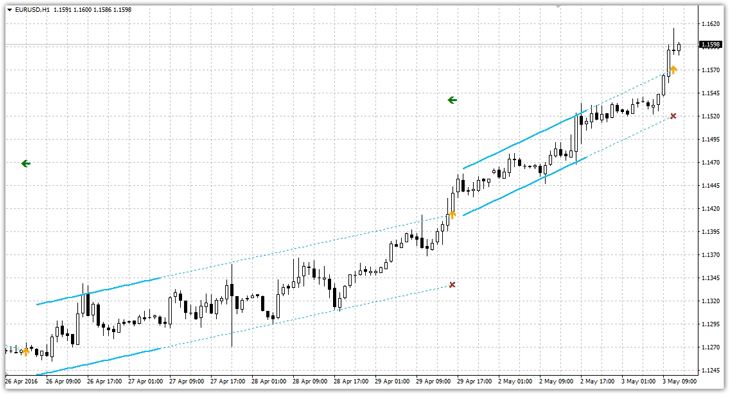
In the settings, you can change the minimum length and maximum width of the regression channel in candles, set the number of bars for calculation, and also set the multiplier for calculating your profit.
In conclusion, I would like to note that the variety of different channel indicators that make automatic construction is simply huge, and they all have a right to exist.
The only thing you should understand is that no script can fully reflect the situation on the market, so for successful trading you should use channel indicators in combination with other Forex indicators .
Download channel indicators .