
Average Directional Movement Index indicator
A trader needs to clearly understand which direction the market is moving, where it is heading at the moment and where it will go in the near future.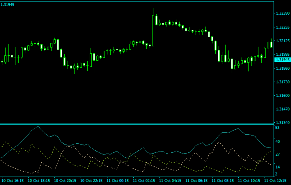
trend forex indicators can cope with this task .
However, despite this, traders continue to suffer losses.
The answer why this happens lies right on the surface, but no one wants to notice it. It is easier to think that forex indicators are wrong about the direction of the trend than to realize that the trend itself has been misjudged.
After all, the effectiveness of the signal in a strong and weak trend will be completely different.
The Average Directional Movement Index, or the more familiar abbreviation ADX, is the development of the highly influential technical analyst and practicing trader Welles Wilder.
The development itself appeared in 1978, when his famous book on technical analysis was actually published.
ADX is a trend indicator that, unlike many other trend tools, not only shows the current trend and its changes, but also allows you to analyze the prospects of the trend, its strength or weakness.
Thus, due to its feature as a complex tool, ADX is often used to build absolutely any trading strategies on any time frames.
Moreover, there are no restrictions on its use on specific trading assets, but you need to understand that it was originally used on futures and stocks.
Installation
The beauty of using the Average Directional Movement Index in practice is that today this indicator can be found in any trading platform.
The fact is that at the time of writing and creating ADX, there were no personal computers and Internet trading in the form in which we have it now.
Therefore, when trading platforms just began to be created, all developers, without exception, replenished their collections with popular developments.
Since the indicator was published in the book, it has gained incredible popularity among the broad masses of traders and investors.
In the most popular platforms MT4 and MT5, this tool can be found by default, and the indicator is located in the category of trend tools. If you plot it on a graph, you will get the following view of the working environment:
Using Average Directional Movement Index
So, before looking at the use cases, we suggest taking a closer look at what the Average Directional Movement Index is.
Firstly, after plotting ADX on the chart, you will see three lines in one window, namely two dotted and one solid.
The solid blue line is the ADX line.
Its purpose lies not in showing in which direction the trend is directed, but in showing what strength the trend has, its potential. Therefore, you should not be surprised when the blue line falls in a growing market and vice versa. The dotted lines, which are called +DI and –DI, show us the trend lines of bulls and bears, and their subtle relationship with each other can show us both the entry point and the clear direction of the trend at the current moment in time.
Therefore, ADX can easily be used for two purposes. As a signal indicator and as an auxiliary filter, which allows you to enter the market only if there is a strong trend or exit the transaction if the trend begins to fade.
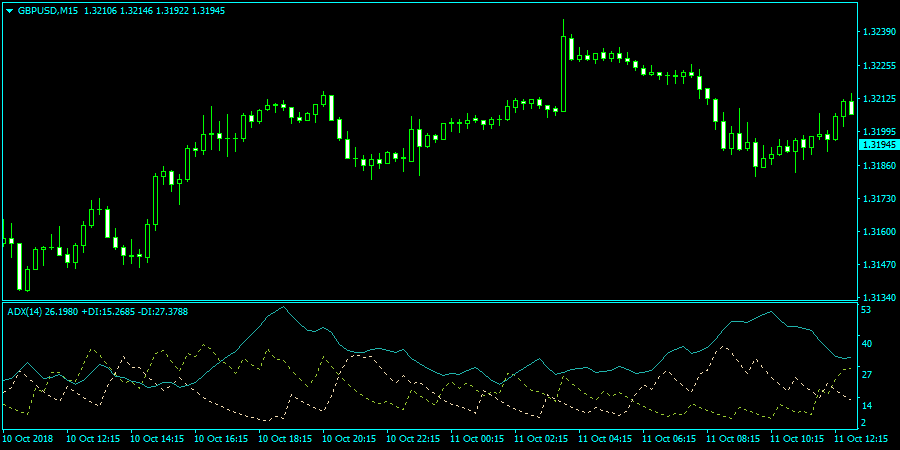
To find the entry point, two lines are used, +DI and –DI.
So, if the lines intersect with each other and +DI (yellow dotted line) is above –DI (purple dotted line) – we open a buy position. If a reverse intersection occurs and –DI is above +DI, we open a sell position. The position in which +DI is above –DI deciphers the dominance of bulls over bears, which indicates an upward trend. If –DI is above +DI then this situation indicates dominance of the bears.
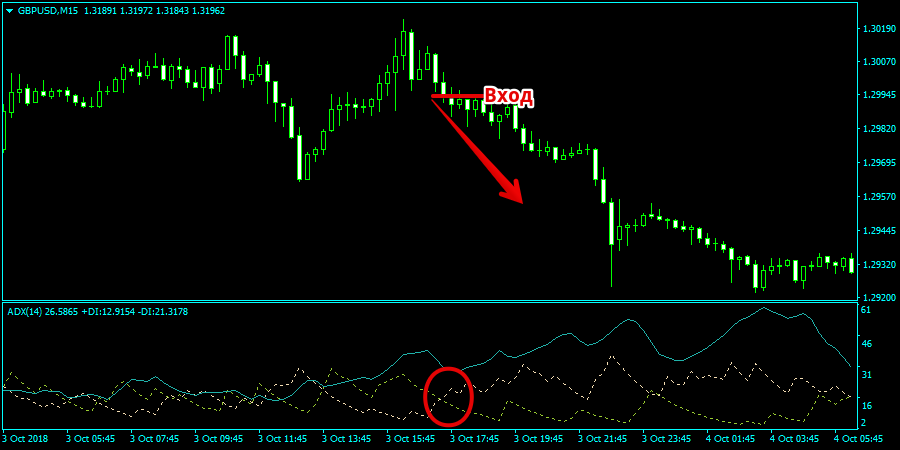
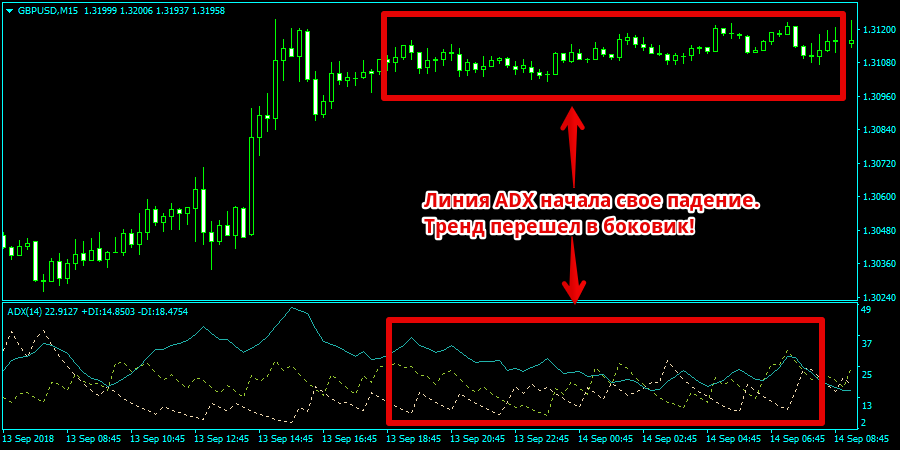
To analyze the strength of the trend, you should pay attention to the scale on the right side of the indicator and the blue ADX line. So finding this line above level 20 indicates a strong trend.
It is worth noting that if you use the ADX line to confirm the strength of the trend according to your strategy, the indicator line must necessarily grow. If you receive a signal and the line falls, the trade is ignored. A simple example of how the ADX line filters signals from +DI and –DI.
Many traders make a huge mistake by trying to position the Average Directional Movement Index as a complete system by using it alone. This approach may not give the desired success since the indicator does not cover all aspects of the market. So be sure to use it as part of a system, but not alone!
In parallel, it is proposed to use the indicator - http://time-forex.com/indikators/ultra-wizard