
Multicharts indicator
Working with one instrument in the Forex market, namely one specific currency pair, greatly limits a trader’s profitability.
For example, if you work intraday and for you 5 transactions on one currency pair according to your strategy is the norm, then the time you spend waiting for an opportunity to enter the market can be measured in hours, and in some cases, days.
To increase their efficiency, most traders prefer to work on different currency pairs and stick to multi-currency trading.
However, when working with different currency pairs on one monitor, a lot of problems arise.
In order to analyze the situation on different currency pairs at the same time, many traders, and especially professionals, buy additional monitors, covering themselves with charts on all sides. Since such a way out of the situation is clearly not a cheap one, and given that the Forex market often acts as an additional income, it is completely a luxury.
The Multicharts indicator is able to solve the problem of simultaneous analysis of various instruments and displays an additional five windows on the chart for different currency pairs, where you can track the dynamics of price changes, apply a couple of indicators and see information on open positions.
Installing Multicharts
The Multicharts indicator is a custom development, so to use it, you first need to install it in the Meta Trader 4 trading terminal. First of all, download the indicator at the end of the article.
In the file we put two versions of this tool, and the first version is installed as an ordinary indicator by dropping the file into a folder called indicators, which can be accessed through the file menu by opening the root directory.
The second version is installed as an installation file, where you need to specify the path to the indicators folder in the root directory during the installation process.
Almost both versions are no different, the only thing is that the second version has the ability to display six additional windows instead of five. After you have completed the installation, drag Multicharts onto the chart of the pair you need:

Basic features of the indicator.
How it works The Multicharts indicator displays the following currency pairs in the first additional menu by default: EURUSD, GBPUSD, AUDUSD, USDCAD, USDCHF.
For obvious reasons, the charts are not displayed entirely, but the last fragments, which allows you to track the current situation on the market. Under the charts in additional windows, the indicator displays how much the price has moved as a percentage relative to the previous day, which allows you to identify fast-growing or falling assets.
To improve the functionality, the developers introduced a moving average indicator, which is displayed directly on each chart.
When opening positions, the placement of orders is visually visible on the chart, which makes it easy to monitor the situation with open positions. Moving averages can give a signal when they cross, but Multicharts is intended primarily for simultaneous monitoring of the situation on several currency pairs.
Multicharts settings
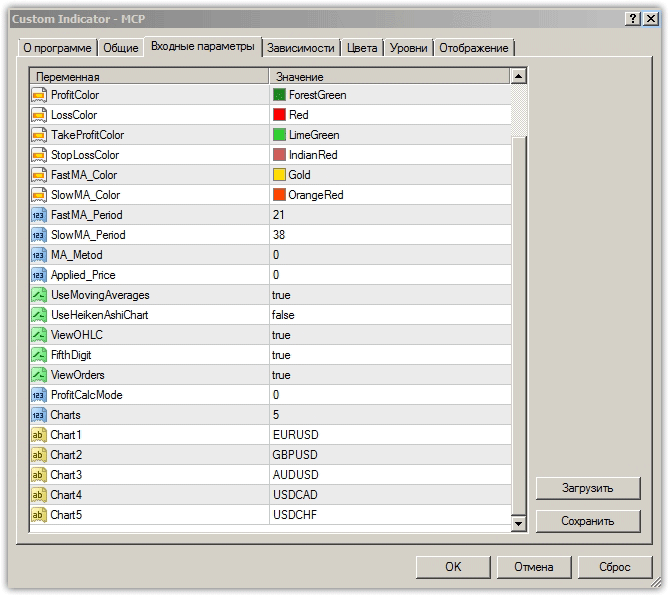
The settings of the Multicharts indicator can be divided into graphical and technical.
If we talk about graphic ones, then in the line Bear candle color and Bull candle color you can change the color of the bearish and bullish candle. In the Fast MA color and Slow MA color line, you can change the color of the fast and slow moving average.
The Profit color and Loss color lines specify the color of the order and profit stop lines.
If we talk about technical settings, in the Multicharts indicator you can enable or disable the display of moving averages in the Use Moving Average line, while you can set the period of the fast moving average in the Fast MA period line, the slow one in the Slow MA period line, and the type of the moving average in line MA method.
You can also enable Heiken Ashi candles in the Use Heiken Ashi line.
In the Show OHLC prices line you can enable the display of OHLC prices. To enable or disable the drawing of orders, you need to select the appropriate option in the ViewOrders line. In conclusion, I would like to note that the Multicharts indicator is able to solve the problem of simultaneous monitoring of different currency pairs on one chart, the only thing is that in terms of analysis, this tool uses only two trend indicators, which are clearly not enough for full-fledged trading .
Download the Multicharts indicator.