
Trendwave indicator
Trendwave is a unique development of a foreign trader, which is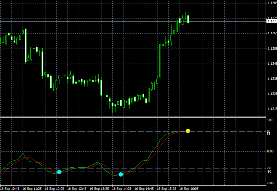 an oscillator indicator based on overbought and oversold zones.
Just a year ago, this indicator could not be found in the public domain, since its author sold it on various trading platforms for quite a large sum.
Of course, as usually happens in trading, sooner or later everything paid becomes free, since all it takes is one dissatisfied person for this miracle to be freely available.
According to the author of Trendwave, his indicator shows possible price turning points, which allowed him to make a considerable fortune.
Moreover, the author notes that this is not an ordinary oscillator that is profitable only in the flat area, but a completely capable indicator in all areas of the market. Therefore, in view of its effectiveness in finding a new trend, the indicator received the symbolic name “Trend Wave”.
If we talk about the segment of users who have already tested the indicator in practice, the reviews are quite ambiguous. Some claim that the indicator really works and shows reversals, demonstrating their real transactions, others claim exactly the opposite.
Therefore, I do not recommend treating this tool as the Grail, but rather using it as one of the effective tools in your trading strategy.
Since Trendwave is a proprietary development, it is not available by default in the Meta Trader 4 , so it should be installed. To do this, download the indicator at the end of the article. Next, through the file tab, enter the data directory of your trading terminal and place the indicator in a folder called Indicators.
After you have installed the indicator, you should restart the trading platform so that it appears in the list of instruments. After restarting, go to the indicators menu and drag Trendwave onto the chart of the currency pair.
A settings window will appear in front of you, in which you can change the period for calculating the indicator in the Wave Period line, and adjust the smoothing of the indicator line in the AVG period line. If you did everything correctly, the indicator should appear in the first additional window in the form of two lines of red and green:
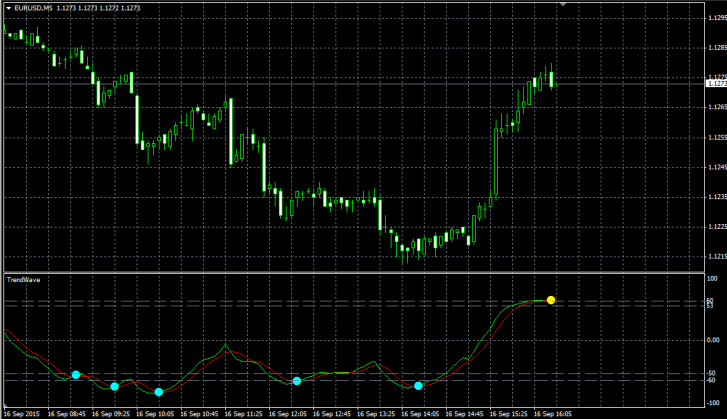 Trading with this tool is very simple. As you can see in the picture above, when the lines cross, a market entry point . Therefore, the signal to enter to buy is the exit from the oversold zone and the appearance of a blue dot.
The stop order must be placed at the local minimum, and you can exit the position at a given profit equal to the stop order or when a signal appears in the opposite direction. You can see an example in the picture below:
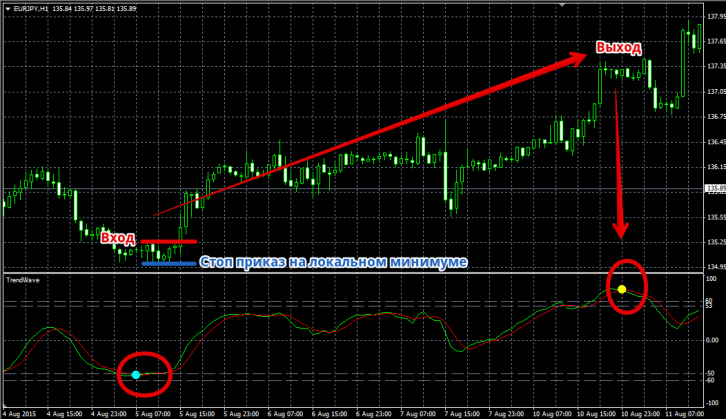
A sell signal appears when the indicator line leaves the presold zone and a yellow dot appears. We set the stop order at the local maximum, and set the profit equal to the stop order. You can also exit on the opposite signal. You can see an example of a sell transaction in the picture below:
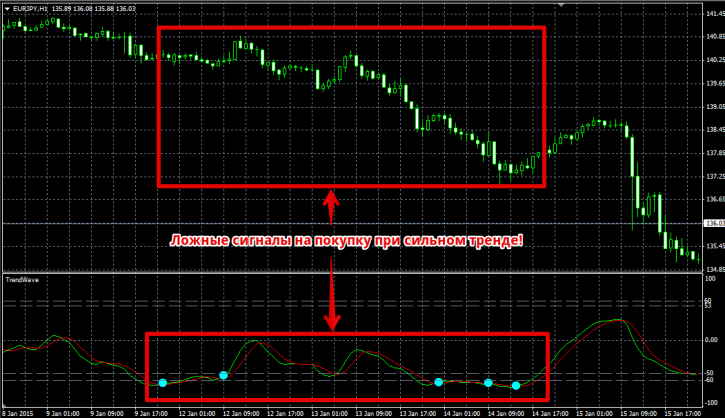
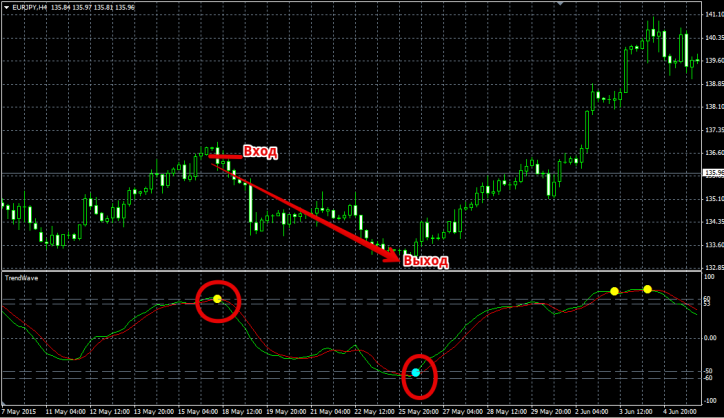 Despite all the statements by the author of the indicator and the people who liked it that it works well both in a trend and in a flat , it turned out on history that Trendwave is still designed to work in a flat and gives a lot of false signals in a protracted trend . Without being fabulous, you can see this for yourself by looking at the picture below:
 In conclusion, I want to say that you should not chase possible price reversals, since they have not yet come up with such an indicator that could predict one hundred percent that the trend has exhausted itself and a reversal will begin. Therefore, I recommend using this tool only if you observe that there is a clear flat in the market, and treat the emerging signals not as a trend reversal, but as a possible trend rollback .