Spearman indicator
Traders who often criticize technical indicators and refuse to use them, pointing out that they are not based on an effective algorithm.
Also critics technical analysis argue that indicators use historical price in their calculations, so the signals will always be lagging.
The development of Forex trading has given rise to the creation of thousands of ridiculous tools that look rather colorful and have no practical use, but not all indicators are as toothless as critics make them out to be.
For example, the Spearman indicator contains a complex mathematical formula that is designed to search for rank correlation.
Therefore, the Spearman indicator is a multi-currency and multi-timeframe tool, and the version we will consider in this article not only displays correlations chart with the instrument, but also indicates turning points.
Setting the indicator
The Spearman indicator can be installed in two ways in your MT4 trading terminal. The first is to enter the MT4 market through your terminal and enter Spearman Divergence Indicator in the search bar.
Once you find the indicator in the market, simply click “download” and the instrument will automatically appear in the list of indicators.
The second installation method follows the standard scheme, namely, you will need to download the indicator from the page of this site and place it in the appropriate directory of the data catalog.
To access the data directory, go to the file menu of your terminal and click on “data directory” in the list of options. After launching the directory, you will see a list of folders, among which find indicators and drop the Spearman indicator into it.
Next, you should restart the trading terminal, after which you just need to drag the indicator onto the chart.
Features of application. Signals
The Spearman indicator under consideration is an improved version of the simple Spearman oscillator. A signal appears when a divergence is detected between the price chart and the Spearman oscillator.
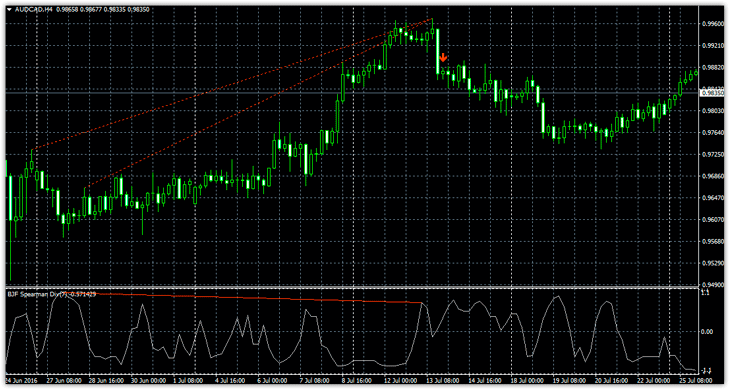
To identify a signal, the indicator considers the price fractal, so if the Spearman fractal is below the previous one on the chart, a downward divergence is confirmed. Actually, the trader does not need to search for divergence himself, since the Spearman indicator will visually indicate it.
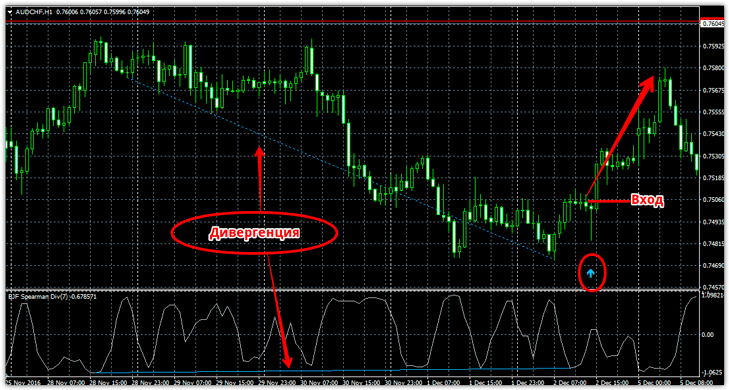
Buy signal
1) The Spearman indicator finds a bullish divergence and displays a blue upward arrow.
Sell signal
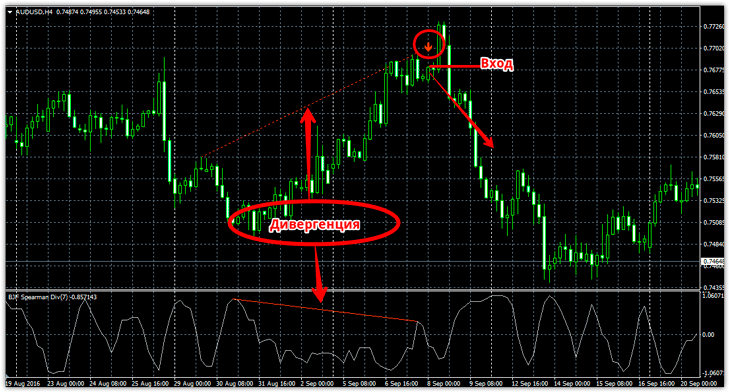
1) The Spireman indicator finds bearish divergence and displays a red downward arrow.
When entering the market, it is not necessary to wait for the candle to close, since the indicator arrows are not redrawn; moreover, the signal is given with an offset of several bars. Example:
Settings
The Spearman Divergence Indicator under consideration contains a wide range of settings that affect both the Spearman construction itself and the identification and display of divergence signals.
So, in the Spear Range N line you can change the period of the indicator, namely the number of bars on which the Spearman rank correlation is calculated. The Max Bar line sets a limit on the candles on which divergence is displayed.
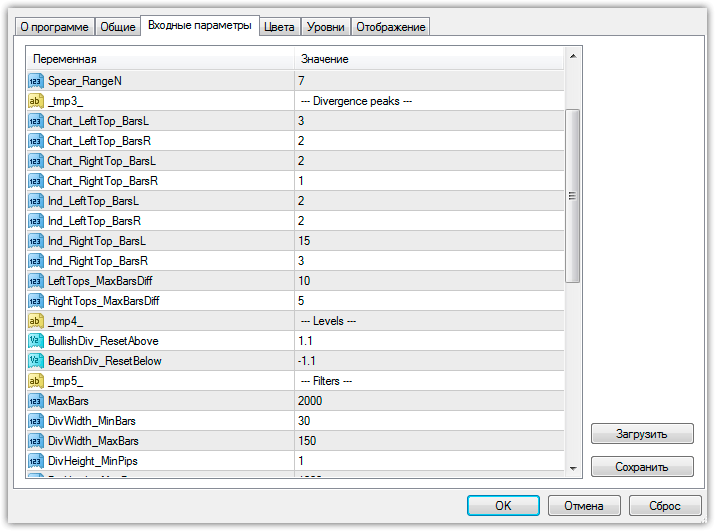
The DivMinBar and DivMaxBar values specify the minimum and maximum number of bars to determine divergence, and the DivMinPips and DivMaxPips lines specify the minimum and maximum value of the divergence in points.
Also in the indicator settings, you can activate a sound alert, a pop-up window, and even sending an email when a signal appears.
In conclusion, I would like to note that the Spearman indicator is an excellent reversal tool for technical analysis (http://time-forex.com/tehanaliz/instrumenty-teh-analiz), however, in order to cut off the maximum number of false signals, you should monitor the news background.
Download Spearman Indicator.
