
Transaction risk indicator
Most traders associate the work of indicators in a trading platform only with trend analysis and sending signals to open trades.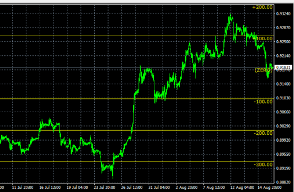
But there is also a category of forex indicators that perform auxiliary functions and simply make trading more comfortable.
The tool presented today belongs precisely to this category of auxiliary indicators; it displays the degree of risk on the chart of a currency pair.
Moreover, he does this not in abstract points or percentages of the deposit, but in the currency of the deposit.
Allowing in this way to assess probable profits and losses relative to the trend line, to evaluate possible prospects.
That is, find out how much you will be able to gain or lose if the price changes to one or another indicator.
After this operation, the settings window will open:
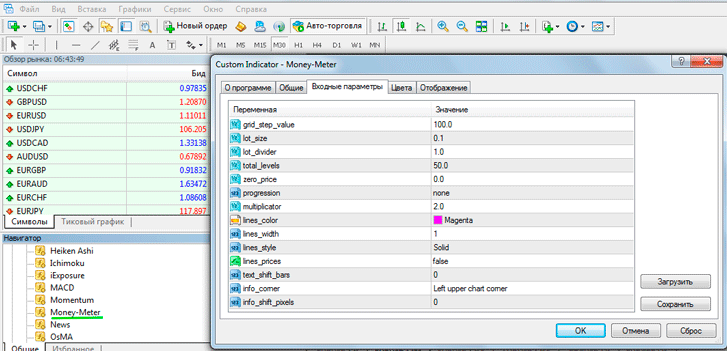 • grid_step_value – distance between indicators, by default 100 units
• lot_size – trade size in lots that will be used in the calculation
• lot_divider – amendment for the lot (divides the volume by this number)
• total_levels – number of levels used, the larger the time frame , the indicate the larger value
• zero_price – the price value from which the calculation will proceed
• progression – progression type
• multiplicator – multiplier for progression
• lines_color – display color on the chart
• lines_width – line thickness
• lines_style – style of grid lines
• lines_prices – display of the price of grid levels on the scale prices
• text_shift_bars – shift text signatures left/right according to the number of bars
In principle, there is nothing complicated, the main parameter that should be changed is lot_size, here we indicate the volume of the position that you are going to trade.
After all the settings are made, click on OK and see the following picture:
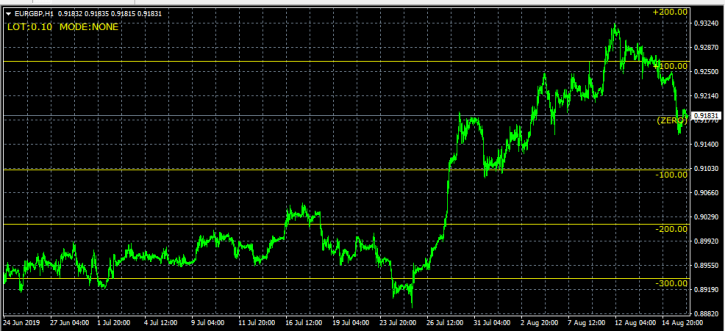 In this case, it may be necessary to change the scale of the graph in order to display as many lines and data as possible.
Overall, you get a pretty useful tool that allows you to realistically assess the likely gains or losses over a certain period of time.
Based on historical data on trend movement. Download trade risk indicator