Fractals and price channel indicator.
Trading using fractals has long been a common practice among Forex traders. This method of technical analysis 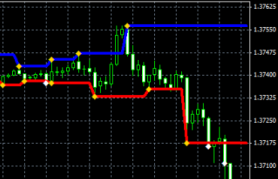 allows one to identify patterns in trend movements and find their most significant points.
The fractal indicator uses points identified through fractal analysis to construct price channels.
The initial impression of this tool is quite good, and it's immediately clear that it can be used for trading in many trading strategies.
Download the Fractals Indicator.
Immediately after adding a currency pair to the chart, two multi-colored lines appear, which act as the boundaries of the price channel. The upper blue line acts as a resistance level, while the lower red line acts as support.
Yellow triangles also appear, representing the price lows and highs at specific segments of the trend. They serve as excellent reference points when opening new trades, as they allow you to assess the current price position in the market.
The setup is extremely simple: you can only change the number of bars involved in forming the lows and highs, thereby making the channel smoother or, conversely, more responsive to price changes. Also, decreasing the Leftbars and Rightbars values increases the number of entry signals, and the price channel itself narrows.
The Fractals indicator has proven itself well when used in the "Level Breakout" strategy; it is clearly visible when the price breaks through one of the channel boundaries and changes its movement. Other trading strategies can be applied if desired.

