Pivot points indicator.
If you want to simultaneously display several popular technical analysis levels on your trading terminal screen, this 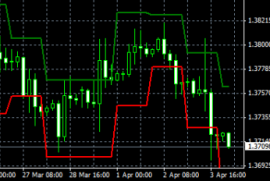 indicator is designed to solve this problem. The maximum timeframe for the indicator is H4, with no minimum timeframe limit.
The Pivot Points indicator plots the following levels: Fibonacci, DeMark, Camarilla, and Woodie. While it's true that sometimes the plotting doesn't follow the usual pattern, this only makes the tool even more interesting.
Each level serves as a benchmark, and depending on the trading strategy used, reaching its boundaries signals the opening of a new trade. The direction is determined by whether the price has reversed or broken through the level.
Download the pivot points indicator.
After copying it to your trader's terminal and adding it to the chart, you'll see six curves running parallel, each representing a different level.

The displayed levels are selected in the pivot points indicator settings on the "Input Parameters" tab.
By changing the TypePivot value from 0 to 4 (the explanation is also provided there), you can choose which levels will be displayed on the currency pair.
This feature allows you to simultaneously analyze the situation on a single time frame in multiple ways and draw the most accurate conclusions.

