Pivots Daily.
Another version of the well-known indicator, which is designed to calculate Pivot levels, the resulting graphic lines can 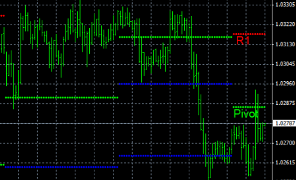 be used when conducting technical analysis of the Forex market.
Pivots Daily is based on a standard script with some operational improvements.
The convenience of this tool lies in its lack of numerous settings; after launching, you simply enter the number of bars to use in the calculations.
This allows for a quick launch, and the resulting Pivot levels will perfectly match your timeframe.
Download the Pivots Daily indicator.
By installing the indicator in your trader's terminal and adding it to the desired chart, you'll receive a large number of green lines (levels). You can estimate their number on the H4 indicator; the lines are presented in three colors: green, blue, and red.
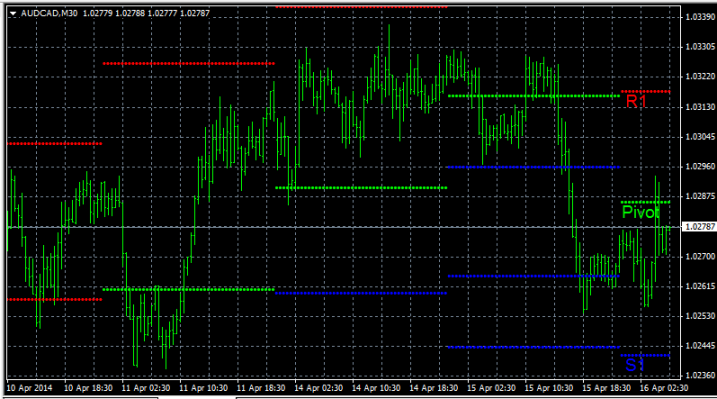
Depending on the color, the levels characterize a specific period of the trend:
• Green - Pivot level for today.
• Blue - Pivot level for yesterday.
• Red - weekly level.
Thanks to the three level options, you can more fully assess the current market situation and make the right decision.

