Automatic support and resistance calculation
This script is designed to plot support and resistance lines. After entering the appropriate settings, it plots several levels on the currency pair chart.
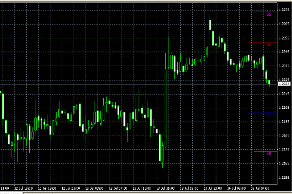
Which allow you to quite accurately determine the minimum and maximum price values depending on the time interval.
The constructed lines are more reminiscent of price levels than support and resistance lines, so working with them has some distinctive features.
Here you will not see a classic price channel, but only levels for different time frames.
This is more of an analytical tool than a means of searching for entry signals, since the script does not provide clear signals and does not highlight entry points.
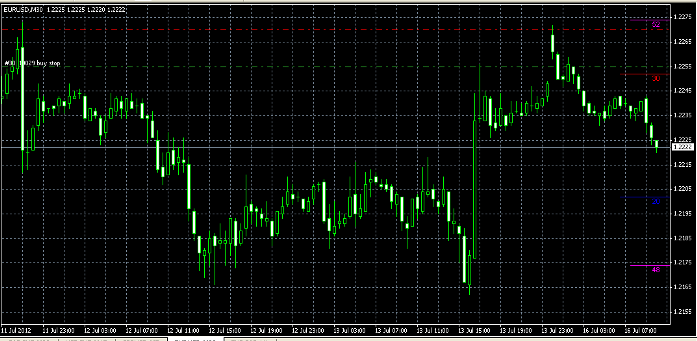
The indicator is well suited for finding points for placing pending orders that will be triggered when a certain level is broken.
After launching it, you can choose at what distance from the current price a new order should be placed.
The support and resistance levels indicator is designed for use on short and medium time frames, the recommended trading time interval is 5 minutes.
The script's operation is based on several fairly complex forex analysis indicators that independently analyze the historical market situation and, based on this, find the necessary points.
For ease of use, an advanced alert system is available, keeping you informed whenever the market price of a currency pair approaches its trigger point. This can be triggered by a simple sound signal on the terminal itself or by sending a message to a specified email address.
Setting up the support and resistance indicator
Sound – enable or disable sound notifications.
Alert – sets the value of the points at which the trigger occurs, indicated in pips.
EmailON – is responsible for sending email notifications to the email address you specify; verification is performed using the test parameter.
PopupON – enables the determination of the distance to the nearest price level, allowing you to track market dynamics.
TrendLine – enables additional levels on the chart, thereby showing support and resistance lines on several time frames at once.
Trading strategy.
The resulting lines can be used both as reference points when searching for market entry points and when placing stop orders.
The strategy itself is no different from similar ones based on channel trading. You will find examples of similar strategies on the page - http://time-forex.com/strategy

