The Time II VBO indicator is a trading session indicator
Trading sessions in the Forex market have a very significant impact on the activity of a currency pair, its strength and speed of movement.
Many traders have unknowingly noticed how, at certain times each day, the market begins to slow down, enter sideways movement, or, conversely, make sharp leaps and break through certain levels.
Many attribute such phenomena to standard fundamental analysis, but currency activity, not its direction, is directly correlated with the trading session.
Trading sessions aren't simply a time range coined by market players; they are tied to global exchanges, which open and close at specific times.
Trading sessions are very often used in trading strategies, since their own patterns are formed over a certain period of time minimums and maximums, levels that players were unable to overcome.
When trading sessions change, players' preferences and appetites change, so barriers that haven't been overcome in one region can easily be overcome by other players.
For example, during the Asian trading session, the need for the European currency is critically low, so we see a narrow range for the EUR/USD currency pair, but at the moment when European players enter the arena during European trading session The activity is simply off the charts and the established range is definitely being broken through.
Each trader can independently use the patterns of price movement during a given trading session and plot these time ranges on a chart.
However, it's best to use the dedicated Time II VBO indicator, which will clearly plot these zones on the chart as areas. Time II VBO is a custom indicator that should be used on a 15-minute time frame, allowing for intraday trading based on breakouts of trading session zones.
Time II VBO Installation
The Time II VBO indicator, like any custom tool, must be installed on the MT4 trading platform. After downloading the indicator at the end of this article, you'll need to place it in the "indicators" folder in the root directory.
To access the platform data directory in a running MT4 platform, open the "File" menu, where you'll find the corresponding menu item.
After you've placed the indicator in the appropriate folder, without restarting the platform, go to the "Navigator" panel and update the tools. After the update, Time II VBO will appear in the list of custom indicators. To display Time II VBO on the chart, simply drag it onto the asset of your choice.
Working with the indicator. Settings.
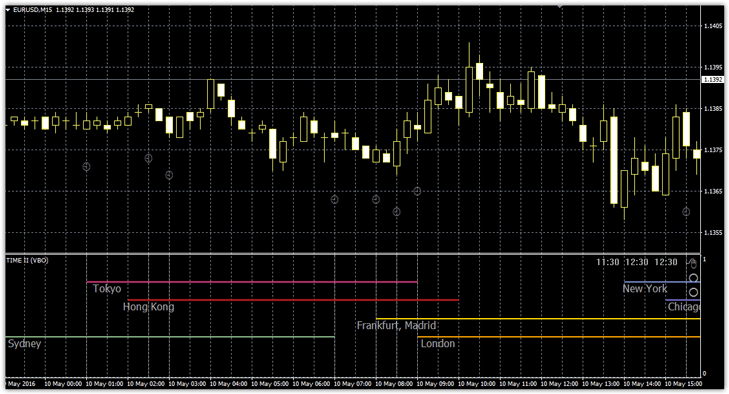
The tool has two operating modes. The first, which you see, marks the working hours of global exchanges and trading sessions in the first additional window, while the second marks trading ranges on the chart itself.
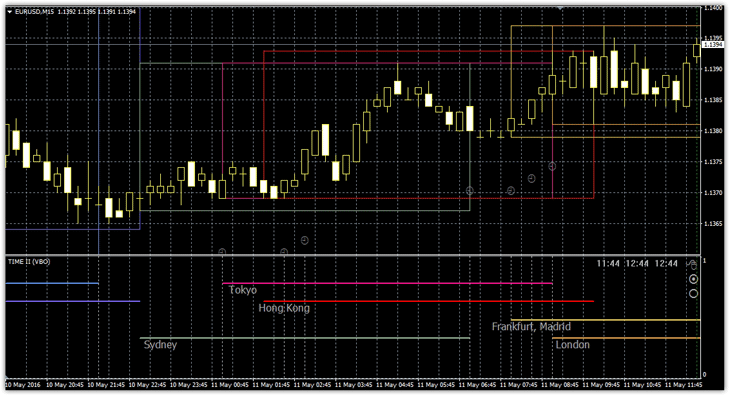
To switch to the second mode, in the first additional window, in the right corner, there's an image of a mouse and two dots. Select this image and drag it down to a specific mode. Once at least one price tick appears, the indicator will change as follows:
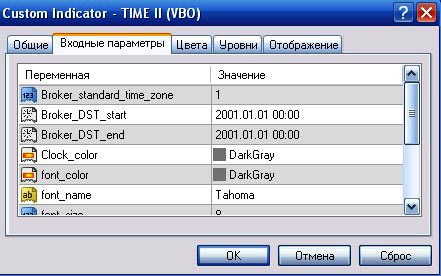
In the settings, you can increase the text font and color settings. It's crucial to check the "Broker standard time zone" lines, which specify the broker's time zone, as well as "Broker DST start" and "Broker DST end," which indicate the broker's daylight saving time transition time.
It's crucial that these values match yours, otherwise the indicator will draw the zones incorrectly.
Practical Application of the Time II VBO Indicator:
As we've already mentioned, during certain trading sessions, price ranges form beyond which the price fails to break. In practice, the boundaries of these zones are the strongest support and resistance levels, especially since a change in trading session is always accompanied by strong breakouts.
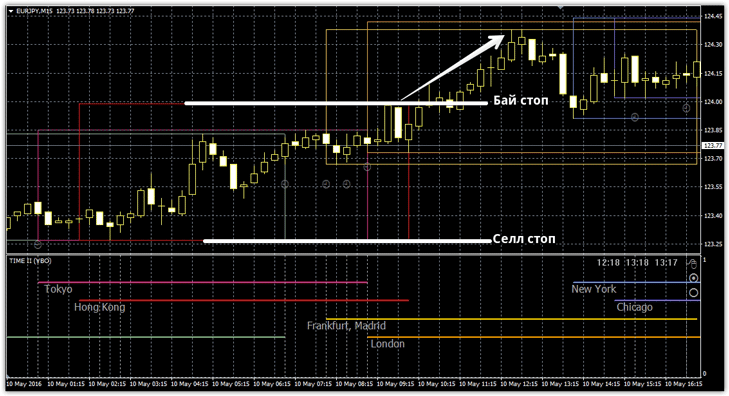
How to apply the script in practice? Since we know that the range boundaries are the strongest levels, we can trade on breakouts of these levels. So, place a pending buy stop order at the upper boundary and a sell stop at the lower boundary.
The stop order should be placed halfway between the two orders, and the profit is equal to the size of the range between the pending orders. See the example below:
The Time II VBO indicator is a versatile tool that not only serves as an assistant, highlighting trading sessions, but can also act as a signal indicator for a breakout strategy.
Download the Time II VBO indicator

