We use the data window to obtain complete information on the time frame
An important component of successful exchange trading is information about the price movement parameters of the selected asset.
Most traders use data such as minimum and maximum prices, opening and closing prices, and the volume of completed transactions in their work.
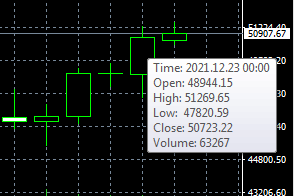
All this information is quite easy to obtain in the MetaTrader trading platform; all you need to do is hover your cursor over the desired candle on the currency pair chart.
After this, a tooltip displaying the above-mentioned data will appear on the screen. If it doesn't appear, you likely haven't checked the "Show OHLC" box in the chart settings.
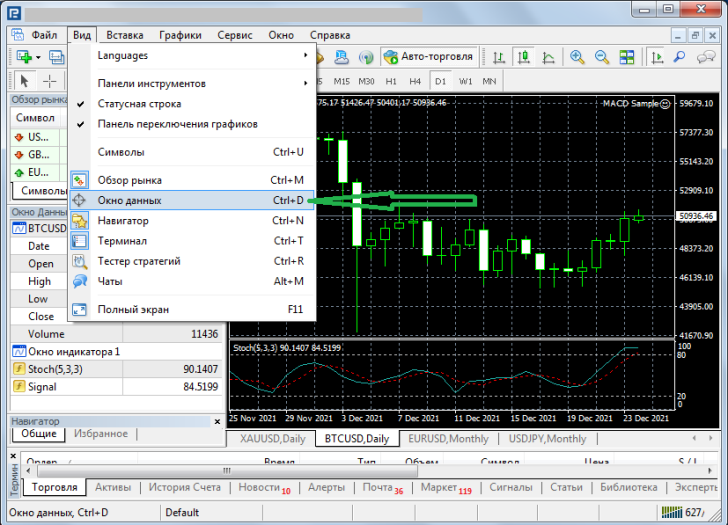
But in order to obtain the necessary information on the timeframe of interest, there is another option, the “Data Window”.
To activate it, simply click on “View” in the top menu of the trading platform and activate the “Data Window”:
After this, an additional window will open for you. In order to get information on the desired candle, you simply need to move the mouse cursor on the chart to the desired candle or bar if you are using a bar chart.
If desired, you can move the data window to a location convenient for you:
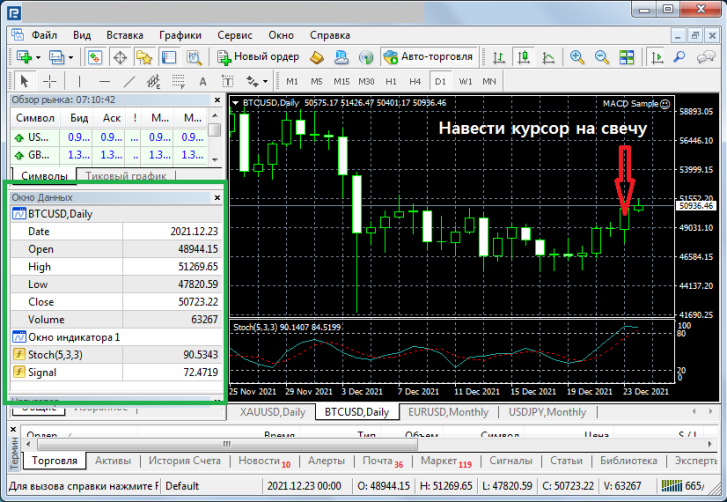
The window displays the following data:
- Name of the asset
- Date and time of candle formation (timeframe)
- Opening price
- Maximum price
- Minimum price
- Closing price
- Volumes
In addition, information on the indicators installed on the chart is displayed at the bottom of the table, which is also quite convenient.
The data window in the MT trading platform helps make working with timeframes more convenient and possibly more efficient.

