
Analysis of completed transactions
In the process of studying stock exchange literature, almost every author devotes an entire section of the book to self-analysis. The fact is that all our work in financial markets, one way or another, is connected with introspection.
Moreover, before we start trading, we analyze our trading strategy on a specific instrument, then we analyze different models of capital management, and then we actually analyze the transactions carried out in order to identify all the positive and negative aspects of our chosen trading tactics.
Analysis of completed transactions is the last step during which it is possible to draw conclusions about the chosen trading tactics and make certain adjustments.
Essentially, by analyzing our transactions historically, we work on mistakes, which allows us not to step on the same rake in the future. However, analyzing completed transactions is by no means an easy process, since in order to find the weaknesses of the strategy it is necessary to spend more than one hour of precious time.
In order to make our life as simple as possible, I suggest using the “Trading Operations Analysis” program, which will allow you to make the most detailed report on your trading tactics, see the profitability of each currency pair with multi-currency trading tactics, and much more.
Installing the application
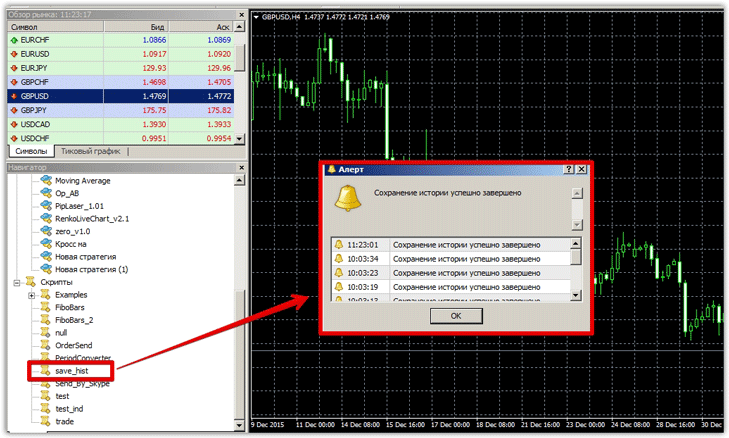
Before starting to analyze the application's capabilities, I recommend downloading it at the end of the article. Due to the fact that the program works purely with the history of your transactions, to collect data you will have to install a special script “save_hist”, which is also located in the archive with the program.
To do this, log into the trading terminal, where you have accumulated transaction history, and use the file menu to launch the data directory. Next, place “save_hist” in the Scripts folder and update the data in the Navigator panel. In order for the script to collect the history of transactions in the required format for the program, simply drag it onto the chart of any currency pair:
 After you have saved the history, run the program and in the file menu, click “Import” and run the file that the script saved for us earlier. If you have difficulty finding the saved file, you can find it in your terminal directory in a folder called “File”.
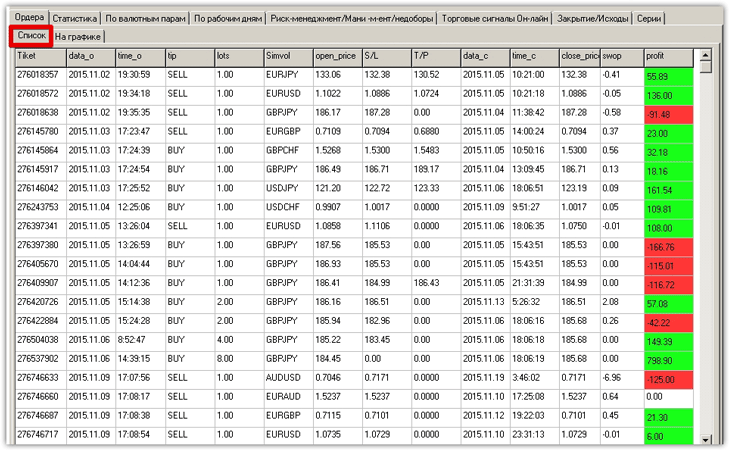
If you did everything correctly, then all your transactions will be displayed in the “List” tab of the program, and they will be immediately sorted and designated as profitable and unprofitable.
Working with the program
The first step we must take is to familiarize ourselves with the trading statistics. To do this, go to the “Statistics” tab, indicate the initial deposit and click on the “Calculate” button. Since we were experimenting with a multi-currency trading strategy, we uploaded our history.
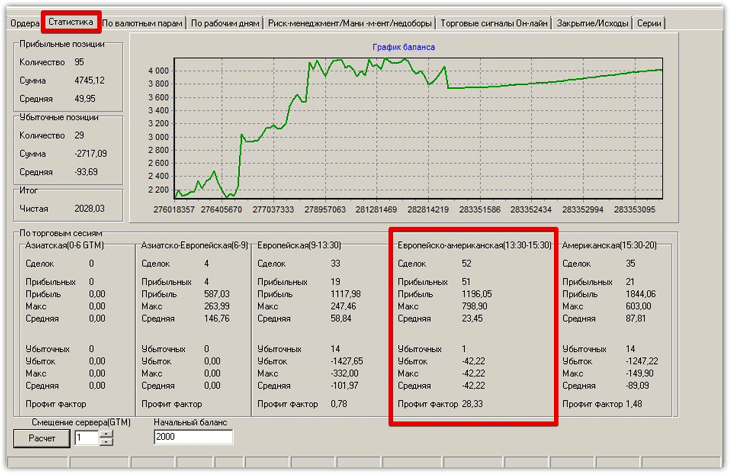 So, the first thing we can observe in the “Statistics” tab is the number of transactions, the total amount of profitable transactions, the average profitable transaction, the number of unprofitable positions, the amount of unprofitable positions, the average unprofitable transaction and net profit.
The program also visually draws a balance graph for us, and after checking it with MT4, it turned out that it looks identical. Working with this kind of programs, I first came across the analysis of transactions depending on trading sessions. The program clearly displays the number of transactions in a certain trading session and the number of profitable ones, their profit factor.
Having analyzed my report, I found out that during the European-American Trade session, the trade strategy with which we conducted an experiment showed the highest profit factor, and the Asian and purely European trading session for strategy are an unsuccessful period.
Such an analysis will avoid many mistakes and choose the optimal trading time for your trading strategy.
The next step is to check the profitability of the strategy depending on the currency pair. To do this, go to the “By currency pairs” tab and click calculate. The program will draw you a graph showing your losses and profits depending on the currency pair, and the graph for each instrument will have its own color.
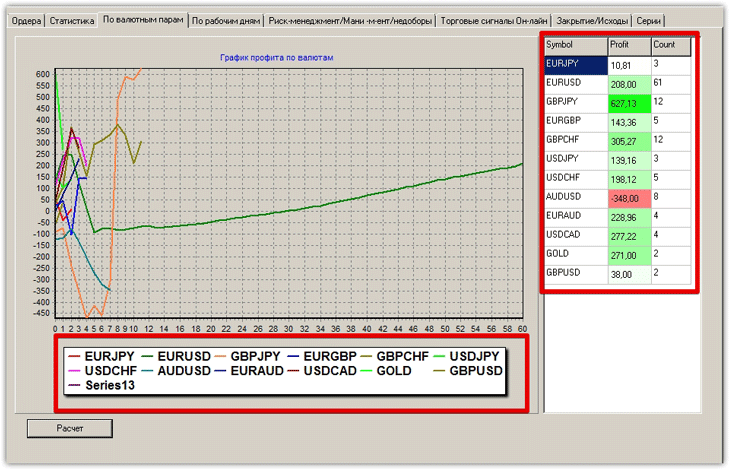 The figure shows how the program clearly identified for which currency pairs the strategy showed profits and for which losses. In our case, it turned out that on the AUD/USD currency pair we suffered only losses, but on the contrary, on the GBP/JPY we received the maximum profit.
This function of the program is very useful when analyzing the history of transactions of multi-currency experts or trading strategies , which will allow you to discard currency pairs on which your strategy is not effective.
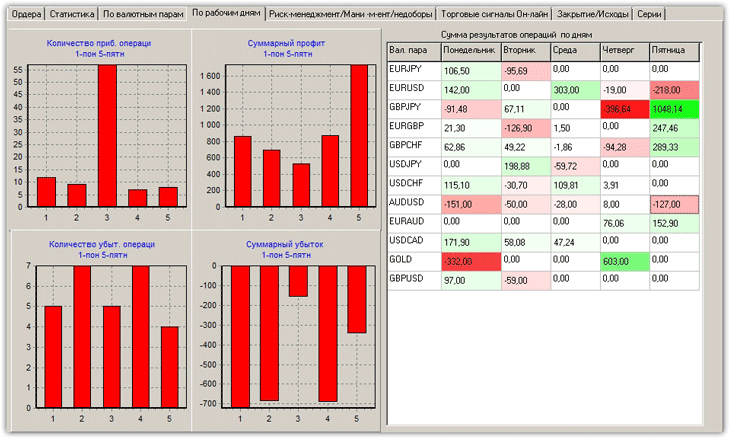
In the “On weekdays” tab you can see the number of profitable and unprofitable trades depending on the day of the week on the chart. Also, in the form of a table for each currency pair, the average loss and average profit are displayed by day. It turned out that Friday turned out to be the most profitable for our trading strategy for GBP/JPY.
 Generally speaking, the program allows you to fully analyze completed transactions. In addition to the functions discussed in the article, you can see statistics on money management, consider the number of unprofitable and profitable positions for each instrument and consider the number of transactions that were closed with profits, stop orders, closed transactions in plus with stop orders and much more.