
Technical analysis with Fibonacci Trader
For everyday trading on the stock exchange, a trader must have an effective trading platform, and to be more precise, a professional trader environment, within which there is a wide range of functionality.
The fact is that markets change from day to day, while the usual platforms for a trader are updated extremely rarely, not to mention the fact that in many cases the functionality of the programs is morally outdated.
Naturally, a trader must be able to adapt to changing conditions, but in order to do this effectively, he needs a wide range of tools that would allow him to conduct technical analysis.
That is why the use of special programs that expand the functionality of basic trading platforms is an integral part of the trading routine of any professional.
The Fibonacci Trader program is a professional platform for conducting technical analysis of the market, both in real time and on historical periods.
It is worth noting that the platform will primarily be useful to traders who practice using Fibonacci tools, as well as those who use technical indicators in their trading.
Installing the Fibonacci Trader program
In order to use Fibonacci Trader you must be the holder of an account on the official page of the developer.
It is worth noting that Fibonacci Trader is a paid software, but you can easily try out all the functionality by downloading a thirty-day trial version.
There is nothing difficult in the registration process, since you will need to enter your name, email and password, and then confirm your registration by email.
After registering on the official website, you will receive a link to download the program. Fibonacci Trader is an independent application from other platforms, so in order to use it you just need to run the installation file and specify the directory where the application will be installed.
After installation, the first time you launch the program, you will be asked to enter your name and password, which you registered on the official website. So, the program will display the following view:
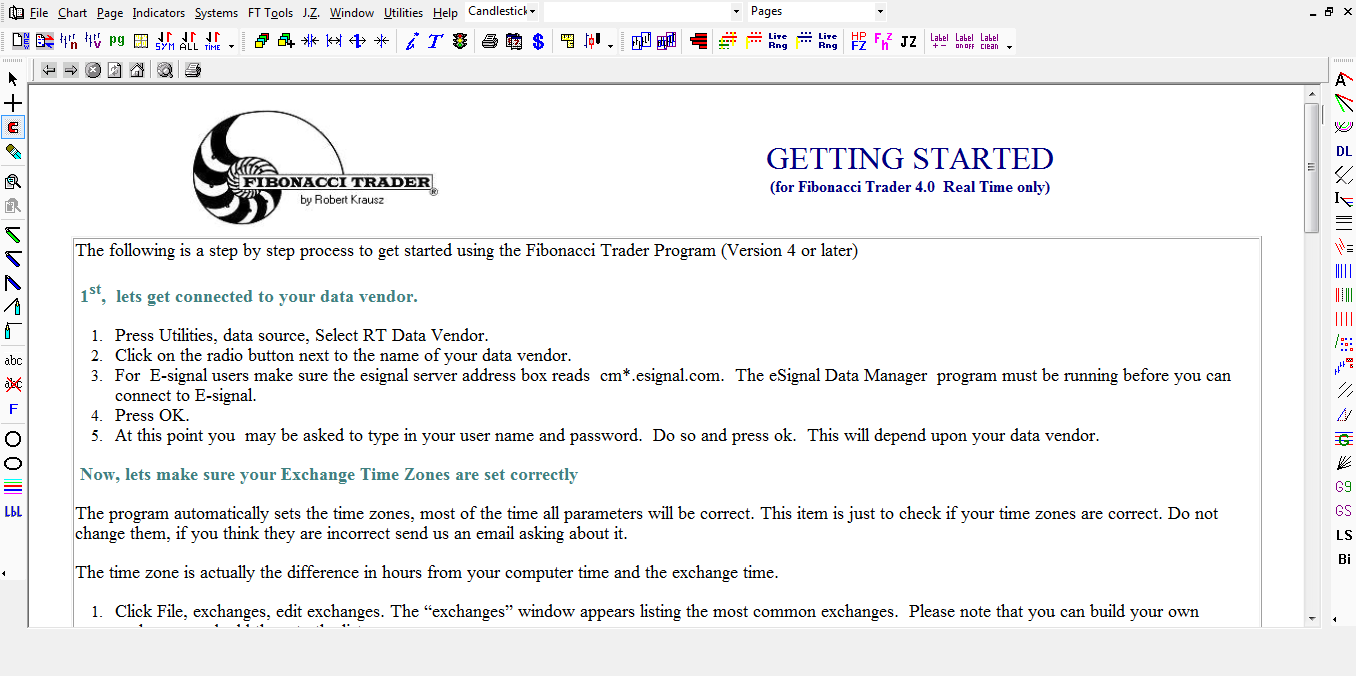
Working with the program
Once you launch the program, you will see three work areas, namely on the left, right and top. At the top there is the main menu, thanks to which you can add indicators to the chart and perform various actions to configure the program.
The panel on the left contains the simplest tools, thanks to which you can mark horizontal and vertical levels, draw trend lines, figures, as well as perform symbols on the chart and make additional calculations.
In the right toolbar you can find all kinds of Fibonacci extensions, namely levels, fans, time zones. In addition to Fibonacci tools, you can find all kinds of tools based on Gann theory, as well as graphical and technical analysis.
Adding a graph
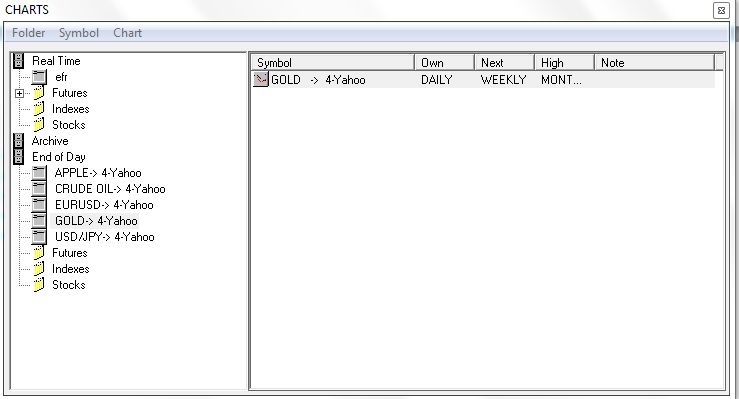
After launching the program, you will need to add a chart of the currency pair you are interested in. To do this, open the File menu in the top panel and select the Symbols menu item.
You will see three options, thanks to which you can add quotes from Yahoo, from exchanges, and also download from history. It is worth noting that the program provides the ability to download any quotes, namely indices, stocks, currency pairs and other assets.
If you decide to add tools from Yahoo, then you just need to enter the name of the symbol of the desired tool.
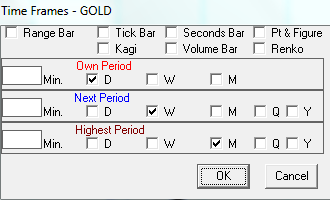
After adding a currency pair, the chart will appear in the central area. In order to change the time frame and chart properties, right-click the additional menu and open the Time Frame line.
After running this function, you will be able to convert yourself time frame depending on which one you need, and you can also choose the type of chart.
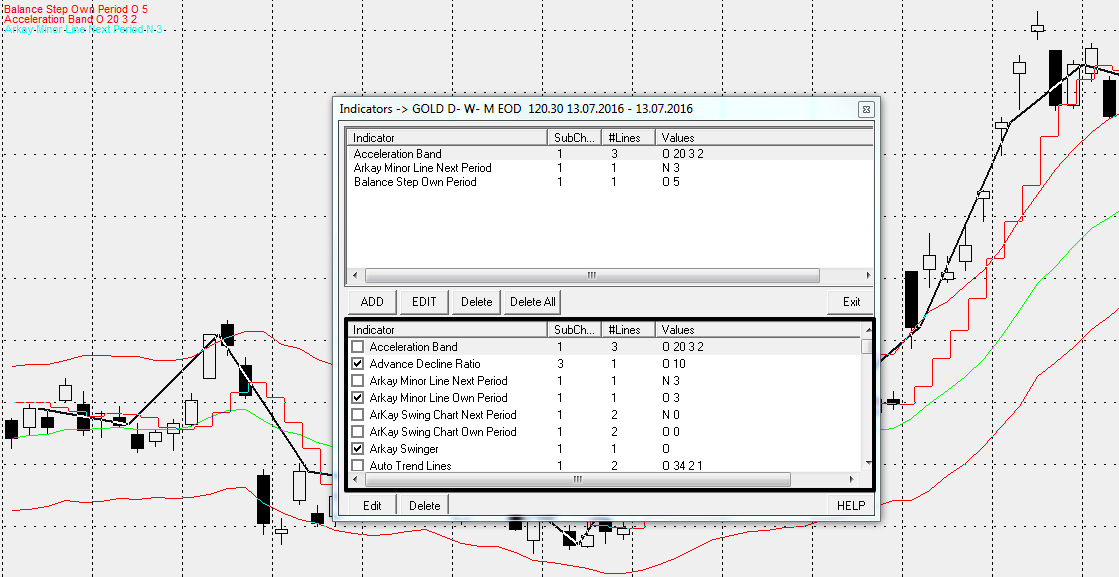
Adding indicators
To add indicators to the chart, go to the top panel and open the menu called Indicators.
By launching this menu, you will see an additional window in front of you, at the bottom of which there are all the indicators (by default there are more than 100 of them).
For convenience, the developer suggests simply checking the boxes for the instruments that you want to see on the chart:
In conclusion, it is worth noting that Fibonacci Trader allows you to conduct the widest analysis of selected currency pairs, and its functionality is an order of magnitude wider than that of metatrader 4 and other similar platforms.
The disadvantages include the lack of a Russian-language version of the program and its high cost.