Tick indicator for the M1 timeframe
A tick in stock trading is the smallest change in the price of a financial instrument. For example, if a stock price is $20.00 and the minimum tick is $0.01, the next possible price for the stock could be $20.01 or $19.99, but not $20.005.
Tick counting in stock trading is used to analyze market volatility, that is, the degree of its changeability.
A large number of ticks in a short period of time may indicate high volatility, while a small number may indicate low volatility. This is important for traders, as volatility directly impacts the potential profitability and risk of trades.
Ticks are also used to create tick charts, which allow traders to see every price change and analyze market dynamics in more detail.
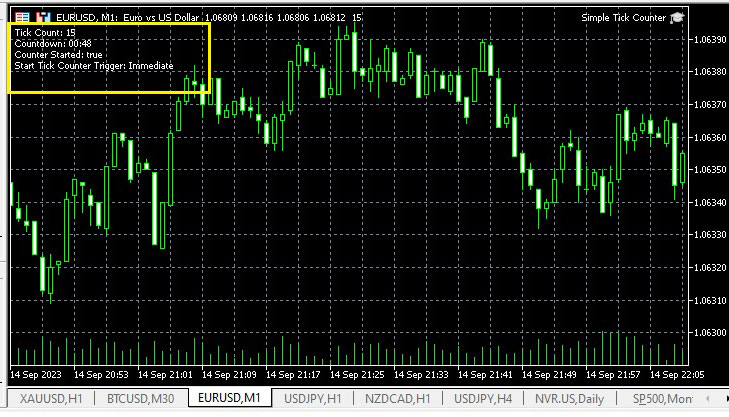
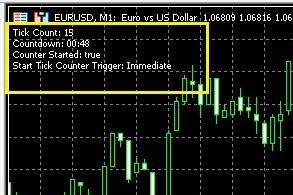
After installing the script and running it on the selected chart, text will appear in the upper left corner indicating the number of ticks on M1 and the time remaining until the end of the timeframe.
The snail performs the following two functions:
- Counts the number of ticks until it is reset by the user.
- Counts down the time on the M1 timeframe until a new candle is formed.
As for the tick counter settings, they are extremely simple and look like this:
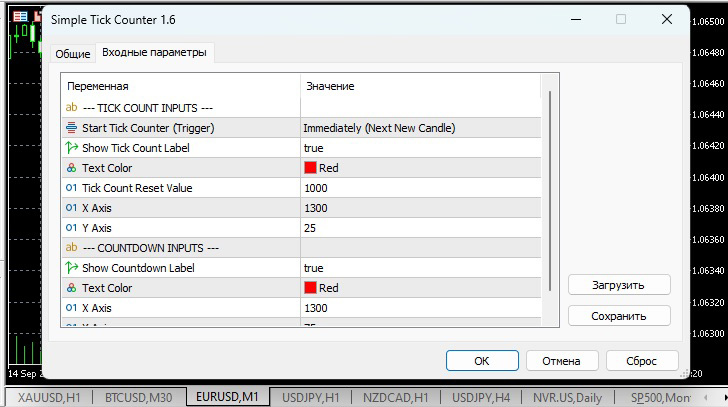
Users can change the following input values:
Input values for tick counting:
Start Tick Counter Trigger : (Immediately/After Next Bullish Candle/After Next Bearish Candle)
Show Tick Count Label : True/False
Text Color - Text color
Tick Count Reset Value - Tick counter reset value
Setting up placement on a chart
X-Axis - X-Axis (Position)
Y-Axis - Y Axis (Position)
Input values for countdown:
Show countdown marker: True/False
Text color
X-axis (Position)
Y-axis (Position)
This tool can be used for pipsing or scalping, its use will make trading more efficient.
If you're interested in tick trading, you might find the Tick Trader trading platform useful - https://time-forex.com/skalping/platforma-tik-forex

