What are chart shifts, auto-scrolling, and volumes for in MetaTrader 4?
A price chart is the primary tool for technical analysis in the Forex or stock markets.
Using a chart allows you to clearly assess the trend's dynamics and identify its key parameters, which are essential for decision-making.
The effectiveness of market analysis often depends on the appearance of price charts.
MetaTrader4, one of the most popular trading platforms today, has several features that make information easier to read. Beginners are often simply unaware of these features, and there's never enough time to read the trading platform's manual
All the above settings can be controlled in the “Charts” menu:

Let's start with the "Volumes" indicator. We're used to using additional indicators.
But in reality, you can simply enable "Volumes" in the chart settings, and the histogram will appear on the terminal screen:
 Autoscroll – allows the chart to automatically move along with the price and time. In most cases, this feature should be disabled, as it prevents you from viewing the price history.
After this, you can easily move the chart to the left and analyze previous price movements.
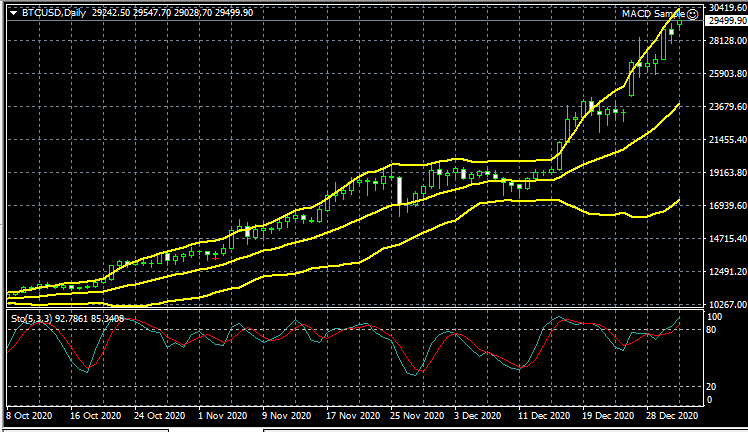
Chart Shift is also a rather interesting feature that few people realize; it allows you to move the chart away from the right edge.
Before enabling this feature, you'll see the following image:
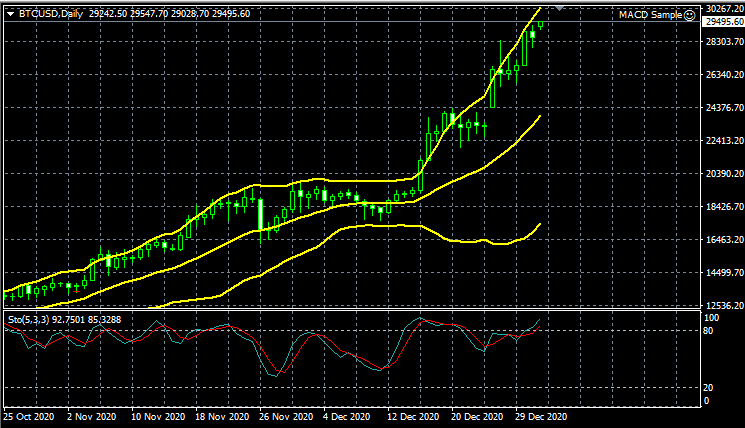
And after adding "Chart Shift," you can see a certain perspective not only on price movement, but also on the movement of all installed indicators:
The MetaTrader trading platform's capabilities are simply limitless; as you can see, just a few clicks can make your work more convenient. You'll find other essential settings in the "Charts" menu.

