
Strategy Sidus Method
Trend trading requires the trader to be able to clearly determine the trend in the market, however, knowledge of one direction in practice is not enough.

The fact is that the presence of a global trend does not guarantee you sustainable movement, since any global trend consists of micro trends.
Moreover, a change in microtrends, as a rule, is accompanied by a kind of accumulation and inhibition of prices, during which it is unknown which category of traders will be in the majority and push the market.
That is why price exit from consolidation in the direction of the global trend is one of the strongest signals of any trend strategy on Forex, since the price very quickly reaches its goal.
Initially, the strategy was applied on hourly charts of the Euro/Dollar and Pound/Dollar currency pairs, however, due to the fact that the tactics are based on ordinary moving averages, you can apply the strategy on any instrument of your choice.
Since market contractions and consolidations are characteristic of any currency pairs and time frames, the strategy can be safely called universal.
Preparing a Strategy Sidus Method
Trading strategy The Sidus method consists of four moving averages with different periods, so you can easily recreate the strategy in any trading terminal, including mobile versions that also have the ability to add moving averages.
To begin, add exponential moving averages with periods of 18 and 28 to the chart, and also assign them the color red.
Next, add exponential moving averages with periods of 5 and 8 to the chart, and also assign them different colors.
If you trade through the popular MT4 platform, we have prepared a template especially for you, after launching and installing which all indicators will appear on the chart automatically. To get started, download the strategy template at the end of the article.
You will then need to launch the terminal data directory via the file menu in your platform.
After launching the directory, a list of platform system folders will be displayed on your screen, among which find the folder called Template and drop the template into it.
As soon as all directory folders are closed, restart your platform, then call up the additional menu directly on the chart and find the “Sidus Method” in the list of templates. After running the template, you will get this type of chart:
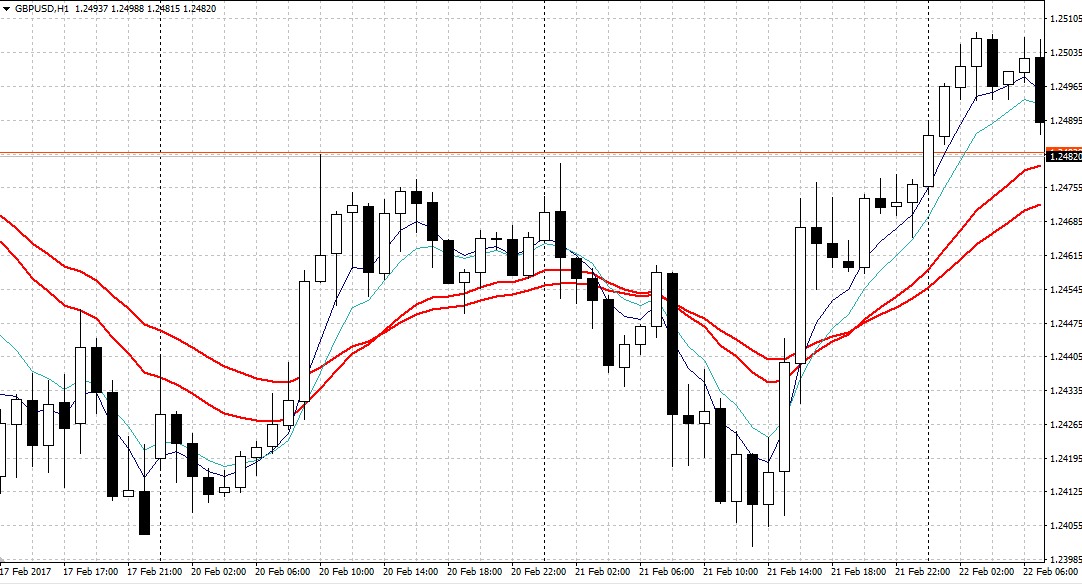
Briefly about the strategy.
Signals Moving averages with periods of 18 and 28 serve as a kind of trend channel, the breakdown of which is the basis for all trading.
It is worth noting that when the lines begin to converge and practically merge into one, a moment of consolidation occurs in the market, the breakdown of which is where all trading is actually carried out.
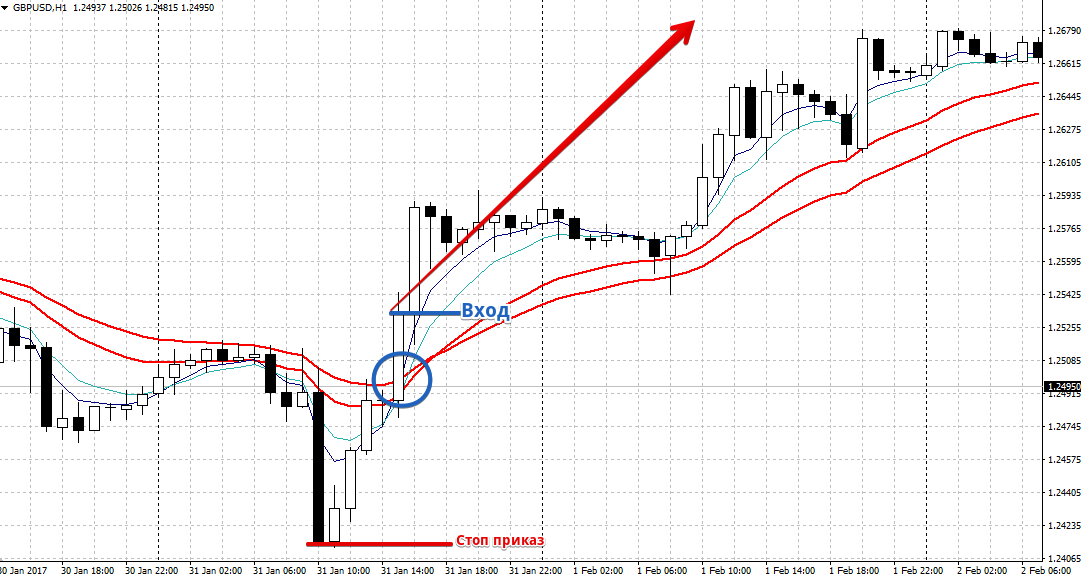
So, let's look at the signals in more detail. Signal to buy:
1) Moving averages with periods of 18 and 28 are as close as possible to each other.
2) Moving averages with periods of 5 and 8 break through moving averages with periods of 18 and 28 from the bottom up.
Entry into a position occurs purely based on a closed candle.
It is very important that the moving average with a period of 5 be above the moving average with a period of 8 or break through it from the bottom up at the time of the breakdown of the narrowed channel. A stop order should be placed at a local minimum, and exit from the position occurs when the channel lines with moving averages with periods of 18 and 28 close again or the moving average with periods of 5 and 8 crosses the channel from top to bottom.
See below in more detail:
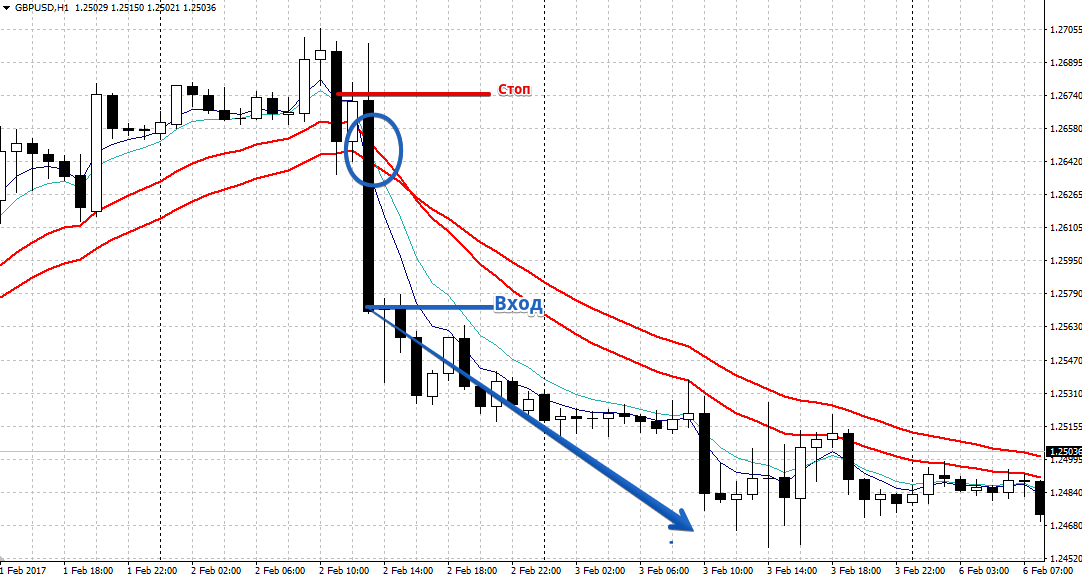
Signal to sell:
1) Moving averages with periods of 18 and 28 are as close as possible to each other.
2) Moving averages with periods of 5 and 8 break through moving averages with periods of 18 and 28 from top to bottom.
As with a buy position, a sell entry occurs only after the signal candle closes.
It is very important to limit risks by setting a stop order at a local maximum, and exit the position when the moving averages narrow in the opposite direction or when an opposite signal appears.
See below in more detail:
In conclusion, it is worth noting that the Sidus Method strategy allows you to cover large trend movements.
However, like any trend tactic, there are a large number of false signals in the flat , as well as large stop orders due to the small delay of the signals.
Download strategy template Sidus Method