RSI Strategy
The RSI indicator is one of the most popular oscillators, used by almost all  traders.
The abundance of trading signals, such as selling and buying in overbought and oversold zones, breakout of the average level and divergence, make it possible to use the indicator even on its own.
However, as practice shows, the RSI is very weak on its own in trending markets, so to enhance the effectiveness of this tool, it is most often used with additional trend indicators.
The RSI strategy is a universal trend strategy based on the most popular RSI oscillator.
This strategic approach is based on the fact that oscillators almost always predict potential reversal points in advance. Therefore, after receiving an entry signal from the RSI indicator, we wait for confirmation of a trend reversal in the trend indicators, which eliminates a host of false assumptions.
Getting the RSI Strategy Ready to Work
Although the strategy's primary indicator is the RSI, it also includes a custom indicator. After downloading the indicator and strategy template at the end of this article, you must install them on the Meta Trader 4 trading platform.
To do this, open the terminal's data directory and place the indicator in a folder named "indicators" and the template in the "Template" folder. After updating the installed components, go to the "Navigator" panel and open the "Templates" tab and run "RSI Strategy." You should end up with a chart like this:
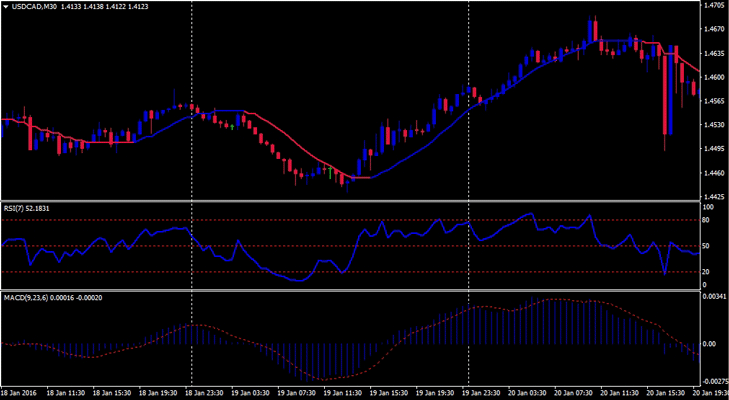
Brief characteristics of the strategy. Indicators
The RSI strategy is multi-currency and applies to 30-minute, hourly, and four-hour charts. The strategy consists of three indicators, two of which are oscillators and are included in MT4 by default. Here's a brief overview of each:
1) NonLagMA. Appearing on the chart as a blue and red line, NonLagMA is essentially a trend indicator. NonLagMA is a non-standard modification of the Moving Average indicator, and its primary purpose is to visually display the direction of the trend.
In the settings, you can set the moving average period in the "length" parameter. In addition to color display, you can enable a sound alert or email notification whenever the indicator changes color, making it more convenient to use.
2) RSI. It's located in the first additional window as a blue line. RSI is a standard indicator in MT4, which you can find in the Oscillators section. The settings only include one line, namely the period. The higher the period you set, the more lagging the indicator will be. However, if you set the period too low, the RSI will be overly sensitive to market noise.
3) MACD. An oscillator-type indicator in the form of a histogram. The settings allow you to specify the moving average periods on which it is based.
RSI Strategy Signals
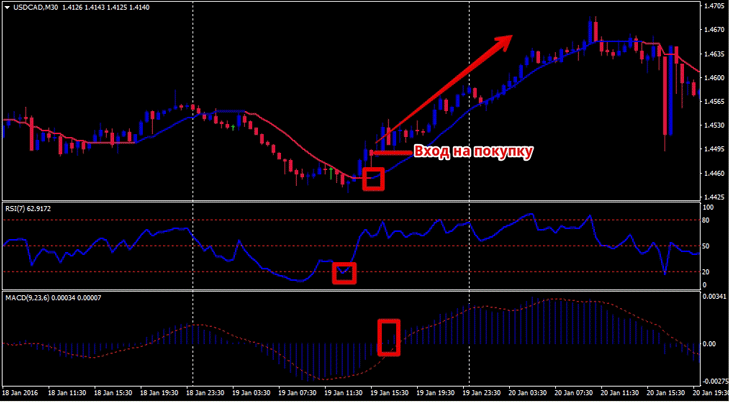
Buy positions:
1) The RSI indicator has touched 20 or is in the oversold zone.
2) We wait for the NonLagMA to turn blue.
3) The MACD is above zero.
It's worth noting that after a signal appears on the RSI indicator, you must wait for the following two conditions to be met. Remember, the RSI acts as a beacon, signaling a future reversal. See the example in the image below:
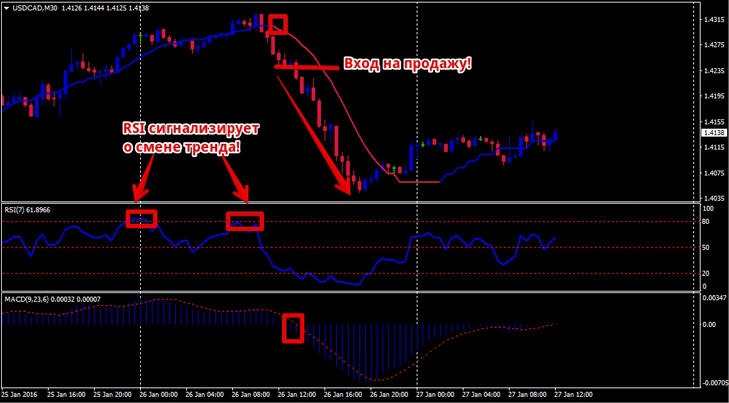
Sell positions:
1) The RSI indicator has touched 80 or is in the overbought.
2) We wait for the NonLagMA to turn red.
3) The MACD is below zero.
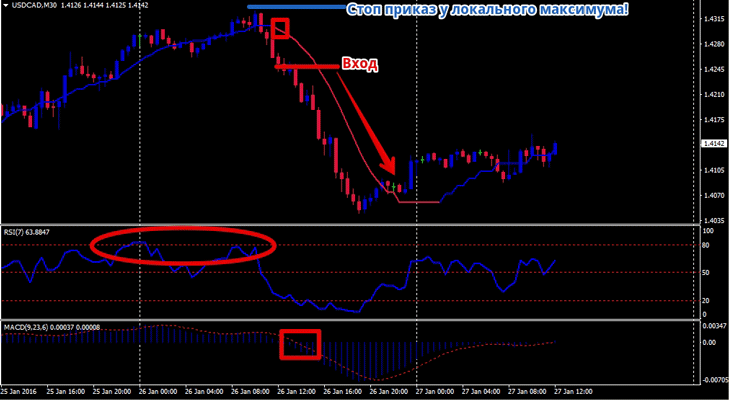
Setting protective orders
Based on our observations, strategy signals are generated near local lows or highs. Therefore, a protective stop order should be placed a couple of pips away from them. See the example in the image:
Subtleties of strategy
Having analyzed possible trades using the strategy historically, it's clear that the addition of trend indicators causes a partial signal lag. However, with proper adjustment of the indicators to the instrument, this drawback quickly disappears.
Download the "RSI Strategy" tools.

