Trading strategy “Super scalper in the channel”.
Everyone knows that scalping is an extremely profitable trading tactic. Ensuring successful execution of transactions while having a small stop is the basic rule of a successful scalper. However, in order to ensure profitable trading over a long period of time and have a balanced and lightning-fast reaction to any price fluctuation, you need to adhere to clear rules of the trading strategy.
The “Super Scalper in a Channel” trading strategy is a scalping trading strategy, and the scalping process itself takes place in a narrow channel, so the strategy can also be defined as a channel one.
It is used on any currency pair, but especially shows itself on the euro/dollar, pound/dollar, and Australian/dollar pairs. Trading is carried out on a minute chart, but if you see that the candles have a poor structure, namely they are poorly formed, I recommend switching to a five-minute chart.
You can see this state of candles early in the morning, when the market has not yet woken up and is little active.
Before you start analyzing trading signals, the strategy must be installed in the Meta Trader 4 trading terminal. At the end of the article, download the file with indicators and a template inside.
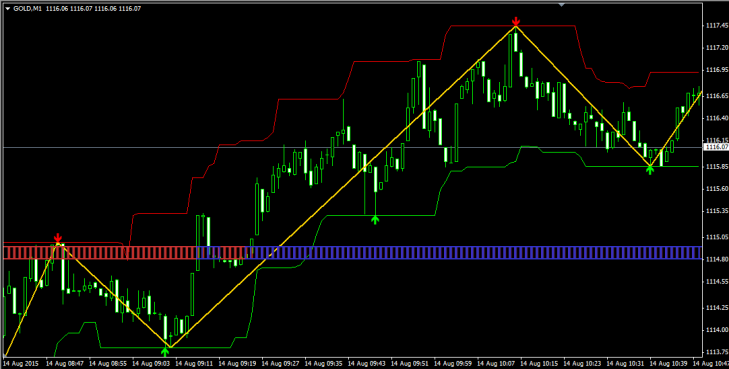
The next step is to enter the file menu of your terminal and open the data directory. Next, you need to place the indicators in a folder called indicators, and the template in the Template folder and restart the terminal. Once launched, go to the list of templates in your terminal and launch the template called “Super Scalper in Channel”. If you did everything correctly, the graph will look like this:

As you can see, a channel has formed around the price, from the boundaries of which we will actually trade. The strategy itself consists of three indicators, one of which is a signal indicator, the second is responsible for the position filter, and the third has an information function. And now briefly about each:
1. Super signals channel – the indicator is displayed as two lines of red and green, forming a channel around the price. The principle of its operation is such that when the price touches the channel border, an arrow appears, which shows us a signal to rebound from the channel border. The indicator is a signal and is the basis of the entire trading strategy. In the settings, you can set the period, as well as the number of bars on which the work history will be visible.
2. Price Channel ZigZag_v2 – displayed as a yellow line and located inside the channel. The indicator is an ordinary modification of the standard ZigZag indicator. It has a more informative function, since it shows the direction of the trend as well as the extremes at which signals to enter a position most often appear. This indicator also helps to search for an exit point from a position.
3. FT PVD – the indicator is displayed as a strip with red and blue bars. In the strategy, it is responsible for the trend filter. If the trend is bullish, the bars are colored blue, if the trend is bearish, then they are red. It is a common modification of the moving average, so in the settings you can change the period of the moving average, as well as its type of application.
In general, the basis of the strategy is clear, and all the indicators that have been discussed can be easily optimized, so it will not be difficult for you to reconfigure the strategy from scalping to trading on older periods. Now let’s move on from analyzing the components to the signals of the trading strategy.
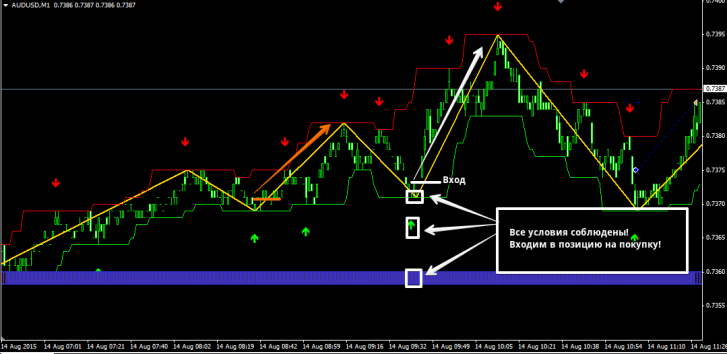
We enter a buy position while simultaneously meeting the following conditions:
1. The price touched the green border of the channel, and the Super signals channel indicator drew a green upward arrow.
2. The line of the Price Channel ZigZag_v2 indicator is directed downwards.
3. The FT PVD indicator bars are colored blue.
We enter a position only on a closed bar! An example of a purchase entry is shown in the picture below:

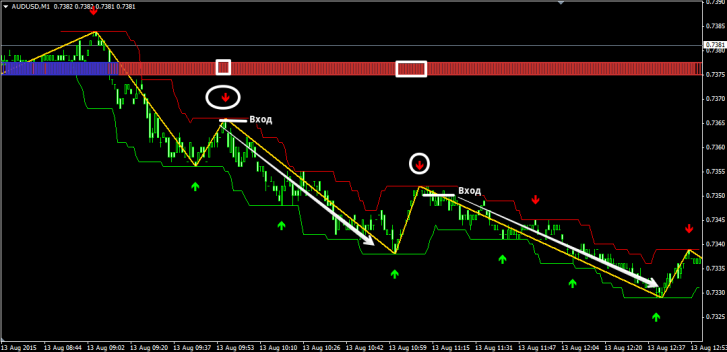
We enter a sell position while simultaneously meeting the following conditions:
1. The price touched the red border of the channel, and the Super signals channel indicator drew a red downward arrow.
2. The line of the Price Channel ZigZag_v2 indicator is directed upward.
3. The FT PVD indicator bars are colored red.
We enter a position only on a closed bar! An example of a sell entry is shown in the picture below:

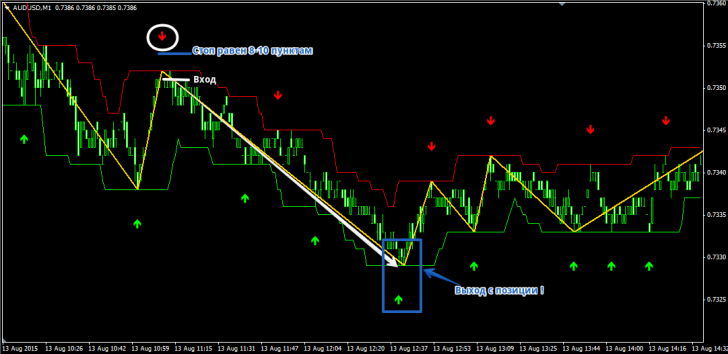
Exit from a position occurs when an arrow appears in the opposite direction. However, I want to note that not only an arrow should appear, but also the line of the Price Channel ZigZag indicator should be at the same point, forming a new extremum.
A stop order must be placed at the minimum or maximum of the signal candle, depending on the entry, as well as local minimums and maximums. The average stop order is 8-10 pips, so you can use a fixed stop order of 10 pips. An example is shown in the picture below:
 In general, the strategy has a number of clear rules that must be followed for successful operation.
Remember, scalping without discipline is a doomed activity. Carefully calculate the risks and do not forget about money management, without which no strategy in the world will be able to bring you a stable result. Download strategy tools.
