Trend Lines Strategy
Many novice traders, after studying graphical and technical analysis, typically begin to develop their own Forex trading strategies based on indicators.

The acquired knowledge of graphical analysis, such as support and resistance levels and trend lines, instantly vanishes from their minds, and if technical analysis is applied, it's done chaotically and unsystematically.
The fact is, people tend to trust something or someone more than simple things and themselves.
Thus, support and resistance levels and trend lines seem simpler and more effective at first glance, yet traders still prefer complex indicator systems.
There's a belief that graphical analysis hasn't worked in Forex for many years. However, in reality, almost no one approaches level analysis systematically, and only rarely does graphical analysis become a system with a set of clear rules and requirements.
Initially, the strategy should be applied on the hourly chart with the entry point specified on the five-minute chart, but if you look a little wider, it turns out that tactics can be used on any intervals and even during scalping on five-minute timeframes.
Drawing trend lines. Trend Lines signals
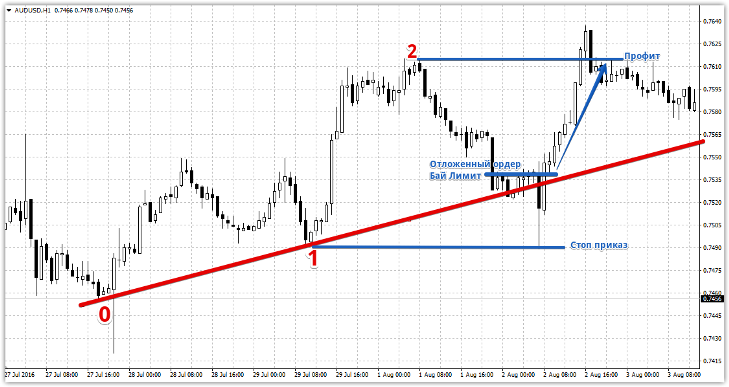
As we've already mentioned, the Trend Lines strategy doesn't include any technical indicators, and all trading revolves around a simple trend line. That's why you should have a clear understanding of the concept of a trend line and how it's constructed. So, let's take a closer look at the signal and the necessary construction for entering a buy or sell position. Conditions for entering a buy position: 1) Draw an ascending trend line through two points (in a bullish market). Mark the first point as 0 and the second as 1 on the chart. 2) Next, wait for the price to bounce off point 1 (the second point when constructing the trend line) and form a local high. After the price begins to decline, mark this local high as 2. 3) When the price begins to approach the trend line (the third point of the trend line is formed), place a Buy Limit pending order near it . Typically, after the price approaches the trend line, the pullback ends and the price moves upward, triggering a buy stop pending order. If this doesn't happen, delete the pending order and ignore the signal. The stop order for the Trend Lines strategy should be set at point 1 (the second point when plotting the trend line), and the take-profit should be at point 2 (the local maximum). Example:
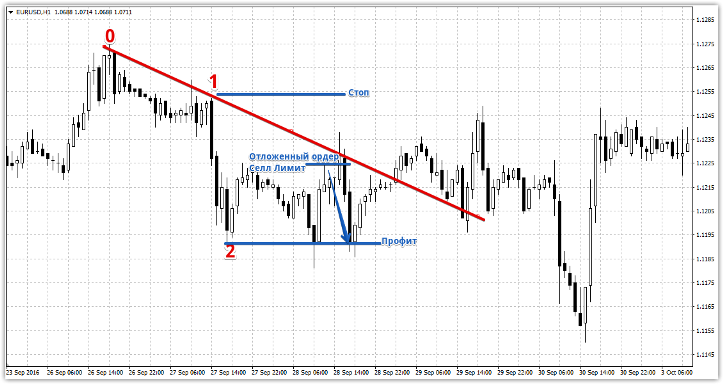
Conditions for entering a sell trade:
1) Draw a downward trend line through two points in a bearish market. As with buy trades, mark these two points with the numbers 0 and 1.
2) Wait for the price to bounce off point 1 (the second point when plotting the trend line) and form a new local minimum. After the price begins an upward movement toward the trend line, mark this minimum with the number 2.
3) When the price begins a pullback from the main trend and attempts to approach the trend line to form a third touch point, place a pending Sell Limit order 5-8 pips from the trend line.
If the price breaks through the trend line and continues its upward movement, and the breakout is not false, the pending order is deleted. As with purchases, a stop order is placed at point 1 (the second point when constructing a trend line) and a profit at point 2. For more details, see the image below:
In conclusion, I'd like to point out that the Trend Lines strategy has enormous potential, as it not only enters the market at the end of a pullback but also takes advantage of a strong pattern such as a false breakout.
Thanks to a limit order, you enter not when the price crosses the mark, but when it reverses, protecting you from a true breakout of the trend line.
It's also worth noting that the profit is typically almost double, and sometimes triple, the stop order. If you see a situation where the potential profit is less than the potential loss, ignore the signal.

