George Lane's Trading Strategy
The biography of any successful trader is full of curiosities and interesting moments that completely predetermine their life.
This probably happens to every extraordinary individual, because you'll agree that achieving such great heights and financial success is far from easy.
George Lane's life would have been different if he hadn't accidentally stumbled into the stock market.
A simple student dreaming of continuing a family line of doctors, he suddenly dropped everything and became a trader.
However, while almost everyone can read his biography, information about his trading strategy, capital management models, and the techniques that actually work is virtually nonexistent.
Why, you ask? Because his Forex strategies are banal and simple, and many of you have unwittingly used them in real trading.
This is what he actually did throughout his entire trading career, as most of his positions were speculative and closed within the trading day.
Lane's strategy is truly simple and universal, and in an interview with one of the financial newspapers, Lane personally pointed out that his strategy can be applied to absolutely any asset and time frame.
Therefore, it is ideal for both speculators and long-term investors. But the most interesting thing is that anyone can master it, as it is an indicator-based system.
Introduction to George Lane's Basic Strategy
George Lane didn't make history because of his vast fortune. No, sharks like Buffett and Soros long ago surpassed him, amassing billions of dollars.
The fact is that George made a huge contribution to technical analysis, since he created the well-known stochastic oscillator or, as it is more commonly known in the language of traders, “Stochastic».
If we talk about the basic principle of the stochastic oscillator, which actually became the basis of Lane's strategy, we can state the fact that this is the most impulsive and at the same time reversal approach.
Even Lane himself gave the example of a rocket, which, having reached its maximum height before falling, must necessarily slow down, gradually indicating to us that his indicator is interesting because it finds overbought and oversold levels.
The most interesting thing is that of all the variations of using stochastics, which are described on various resources dedicated to stock exchange topics, Lane used only two, and always in pairs, namely Divergence and overbought and oversold.
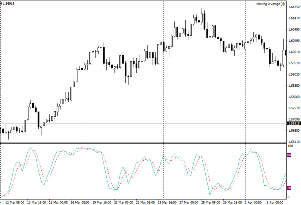
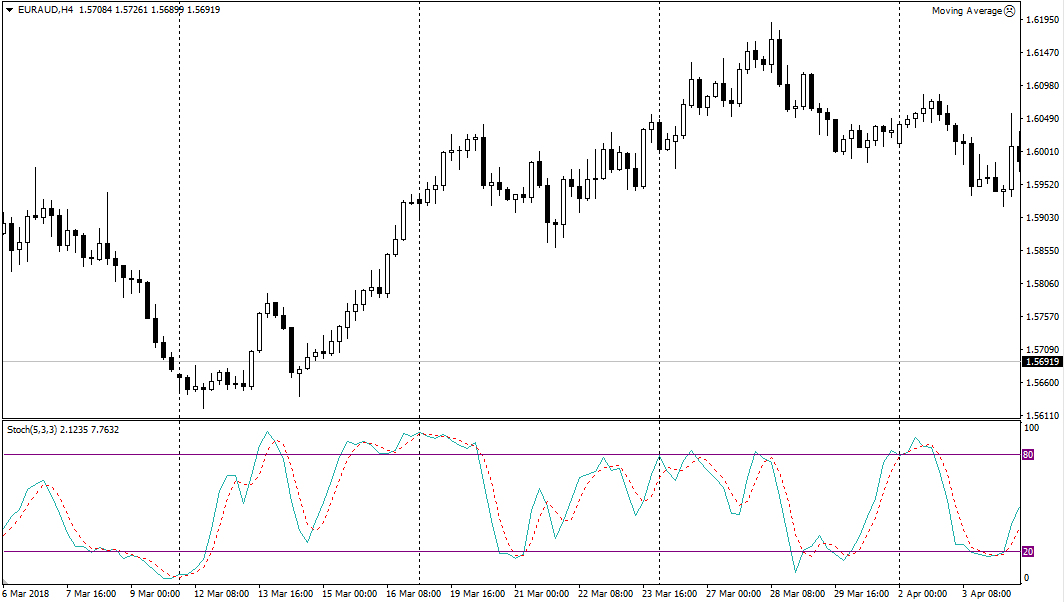
It's worth noting that the stochastic oscillator is currently present by default on any platform, and the desktop with the applied tool looks like this:
Strategy Signals.
George Lane relied solely on divergences when trading his own oscillator, claiming that this type of indicator signal is the strongest.
It's important to understand that divergence is a reversal signal that most often appears at market peaks, and trading it is always counter-trend in the hopes of catching a reversal.
In practical terms, stochastic divergence manifests itself as a divergence between the indicator lines and actual price action.
A classic example of divergence in a bullish trend is when the stochastic oscillator registers a new price high as lower than the previous one, which is not the case.
A bearish divergence typically occurs when the stochastic lines indicate that the new price low is higher than the previous one, which is not the case.
It's worth noting that George Lane's divergences were only valid if they appeared in overbought or oversold zones. So, let's look at buy and sell signals.
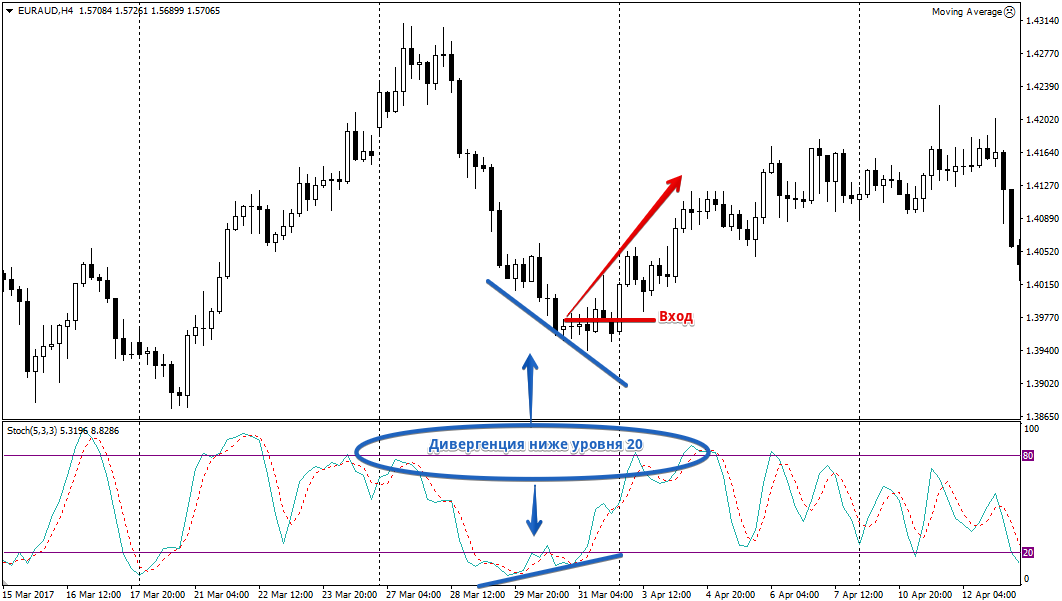
Buy signal:
1. The stochastic line is in the oversold zone (below level 20);
2. A bearish divergence is recorded on the stochastic line while in the oversold zone. Example:
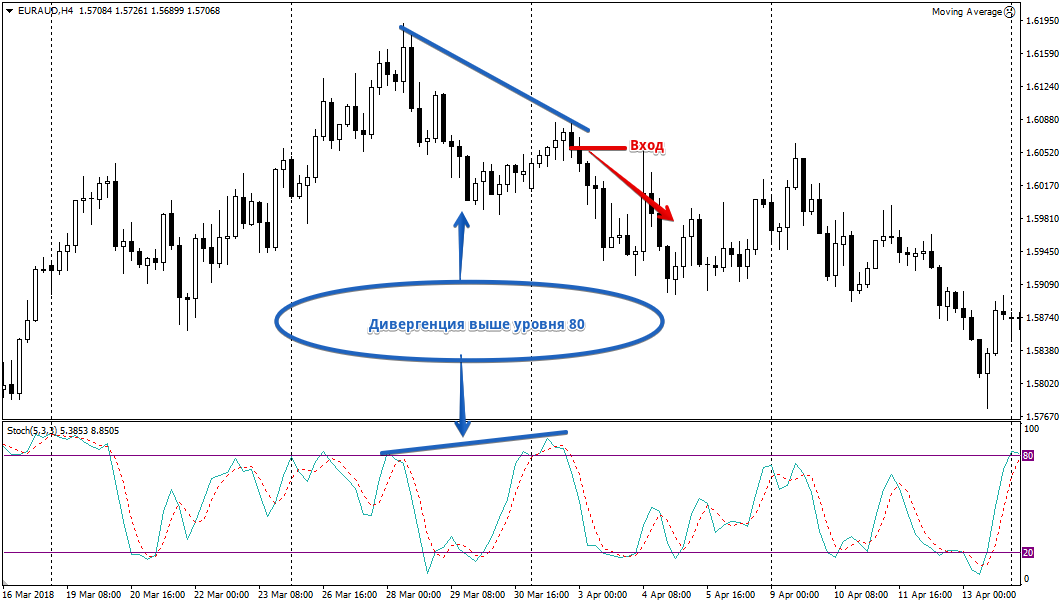
Sell signal:
1. The stochastic line is in the overbought zone (above level 80);
2. A bullish divergence is recorded on the stochastic line while in the overbought zone. Example:
George Lane always used a stop order in his strategy, ensuring it was much smaller than the potential profit from a reversal.
In one of his interviews, he stated that the only thing a trader can truly influence in the market is the size of their own loss.

