NAB Business Confidence Index and AUD/USD
Another important indicator that uses fundamental market analysis is the business confidence index.
A trusting relationship between investor and government is a key condition for the development of successful business in any country in the world.
Agree, if you don't trust the state, don't believe you'll receive your payments without securities lawsuits, or if you simply think your business could be taken away from you, you'll never invest in such a state and its economy.
The Australian Business Confidence Index is a macroeconomic indicator released in the first half of the month, and its main purpose is to measure the level of business confidence in the government and its structures.
The National Australia Bank calculates the index through a survey of 350 different companies, from small to large. This provides a comprehensive picture of investor confidence in the government.
Trading uses of this news are extremely simple. To do this, you need to check the analysts' forecast on the economic calendar . If the figure is higher than expected, it's an excellent signal to buy the Aussie, as its price will rise. If the result is lower than expected, it's a sign of deteriorating business confidence, so you should sell the Aussie.
It's important to know that the result can be above 0 if investment conditions improve, or below 0 if they deteriorate significantly. However, while everything seems quite simple in theory, how does the market actually react to its release, what degree of impact does it actually have, and how many points does the price move on average?
To answer all these questions, I suggest you look at four examples of historical market behavior for the AUD/USD currency pair and draw some final conclusions about the importance of this indicator.
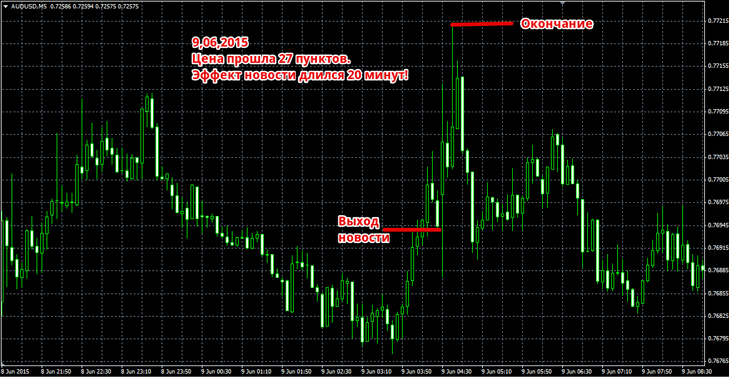
On June 9, 2015, the business confidence index increased by 4 points. Compared to the previous month's data, which was 3, the result was 7, indicating an increase in business confidence and the investment climate within Australia. Based on this positive increase, we should expect a rise in the AUD/USD currency pair. The price chart behavior after the result is shown in the image below:

The example shows that market participants reacted strongly to the positive news, so we can see a rapid price drop of 27 points. The news can be considered explosive, as its effect lasted no more than 20 minutes, after which a pullback and final reversal began just as quickly.
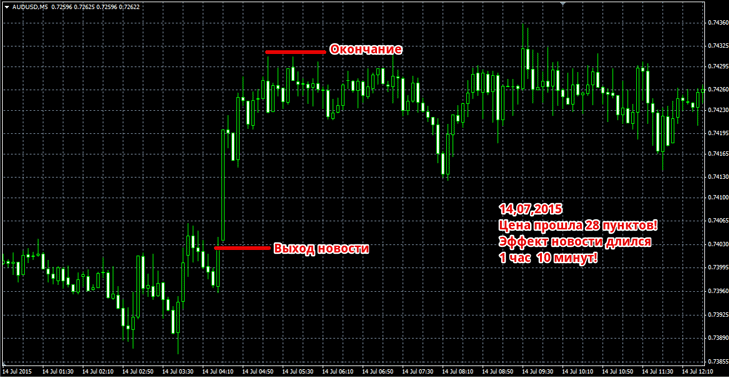
On July 14, 2015, all traders saw the news about another increase in business confidence by 2 points compared to the previous month, since the actual result was 10 against 8 last month.
Thus, it's safe to say that the investment climate has significantly improved, and the AUD/USD pair will trend upward due to the Australian dollar's strengthening against the dollar. The price action is shown in the image below:

Unlike the previous example, the news release's impact on the market was more spread out, lasting 1 hour and 10 minutes. However, despite this, almost the entire movement, amounting to 27 points, occurred in the first 20 minutes. After the price traveled this distance, a narrow flat formed in the market.
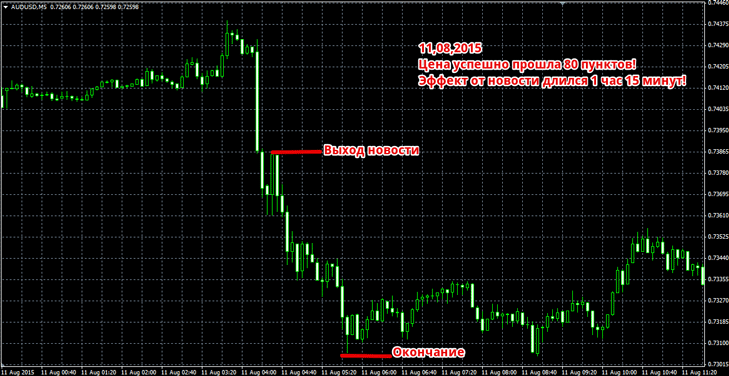
On August 11, 2015, after a two-month increase in the business confidence index, all analysts were inclined to believe that there would be another increase to the 11 mark, but the information that appeared told us otherwise, since the figure received was 8.
Against the backdrop of a gradual increase in the index, such a decline should not go unnoticed, so a downward movement in the AUD/USD currency pair is expected. The price behavior after negative news is shown in the image below:

Conversely, as in the first two cases, the main movement can be observed in the first 20 minutes after the news release, but the market's reaction to the negative news after expecting another positive one resulted in a strong price movement of 80 points.
If we calculate the total time it took the price to reach the target, we get 1 hour and 15 minutes. After the market reaction to the index ended, the chart began moving sideways.
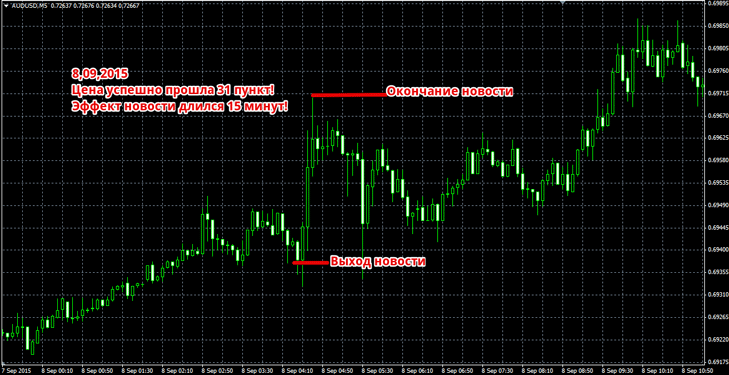
On September 8, 2015, all news sources were reporting that the decline in the business confidence index would fall to zero for the first time in a year. However, the information released in 1 brought a small amount of hope to the hearts of traders that the investment climate was not all that bad.
Therefore, despite the overall deterioration in the situation, a rise in the AUD/USD currency pair was expected. The reaction to this positive news is shown in the image below:

The example shows that, as in the previous scenarios discussed, the market responded very quickly and moved 31 points in 15 minutes. Of course, the price continued to rise, but after the market reaction ended, a pullback occurred, which would have knocked you out of your open position with a stop loss.
A review of four examples suggests that this index has little impact on the market, as none of them demonstrate the kind of violent reaction we see after central bank governors' statements. However, despite this, it's clear that the market is reacting to the data received, pushing the price chart up with a rapid 20-30 pip impulse.
In terms of numbers, with a minimum take-profit of 27 pips and a stop-loss order of the same size, you could have earned 27 + 27 + 27 + 27 = 108 pips of profit by entering the market only four times. Finally, I'd like to add that after the data is released, the market is volatile for 15-20 minutes, and this is when most of the movement occurs, so when trading, you shouldn't hold a position for long periods in the hopes that the market will move in your favor.

