
Delta RSI. Practice of RSI interaction with each other
Classic technical analysis tools such as RSI, Stochastic or Bollinger Bands are described in great detail in many books and websites; moreover, the authors of these tools themselves gave clear and direct instructions for their use.
However, traders, in search of effective signals, began to create their own methods for using standard forex indicators, as well as signals, the use of which was not provided even by the developers themselves.
Some of these strategies are absolutely beyond logic, but despite this, many of these applications become classics and give rise to the emergence of other custom indicators.
One such approach is the interaction of two lines of RSI indicators with different periods, and in this article you will get acquainted with the Delta RSI indicator, which implements this type of signal as a separate and independent tool.
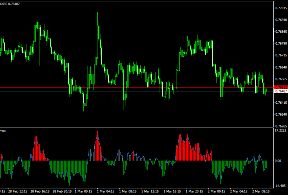
The Delta RSI indicator is a custom technical analysis tool that implements the principle of analysis and interaction of two RSIs with different calculation periods among themselves in the form of a histogram.
Since Delta RSI is primarily an oscillator, it can be safely used on absolutely any trading asset, from currency pairs to CFDs on stocks, indices and even crypto currencies.
It is also worth noting that Delta RSI, like the RSI itself, can be applied to all time frames, which makes it an excellent assistant for both scalpers and long-term traders.
Installing the Delta RSI indicator
The idea of using signals from two RSI indicators with different periods that interact with each other is far from new. However, its implementation as a separate independent indicator occurred only at the end of 2016, and due to the fact that the tool was published in the official library of MT4 developers, it was distributed completely free of charge from the very first day of its existence.
Since Delta RSI is included in the library, you can download it in two ways, namely through the built-in library, or through the data catalog.
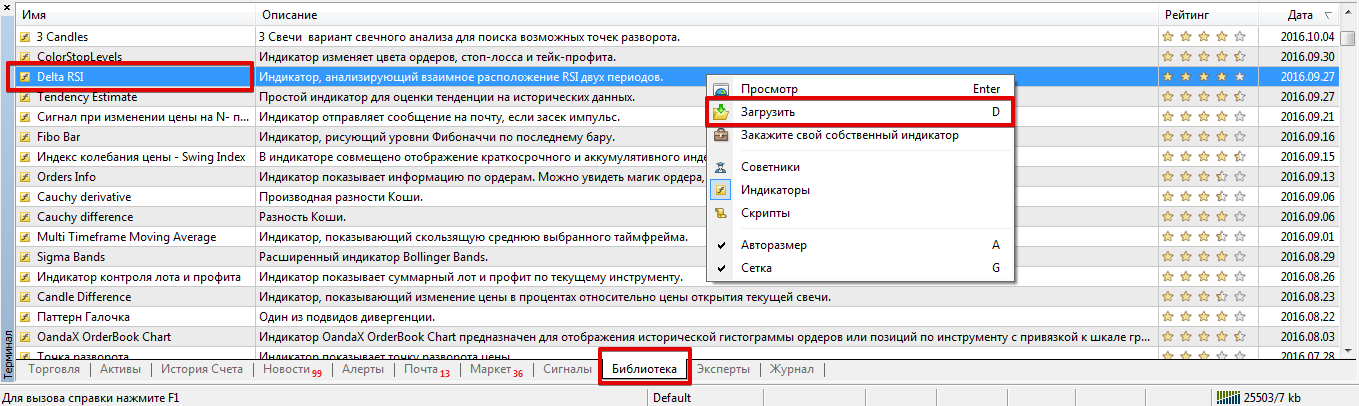
In order to install the indicator through the library, launch your trading terminal and go to the “Terminal” panel, where information on your balance is located. The next step is to move to the “Library” tab and perform a simple sorting so that only indicators appear in the list.
Find Delta RSI in the resulting list and, as shown in the image below, use the additional menu to download.
If installing the indicator through the library is not possible, perform the installation according to the standard scheme.
To do this, go to the end of the article and download the indicator, then place this file in the appropriate folder of the terminal data directory, namely in the folder called Indicators. Next, installation according to the general rules - http://time-forex.com/praktika/ustanovka-indikatora-ili-sovetnika
Application of the script.
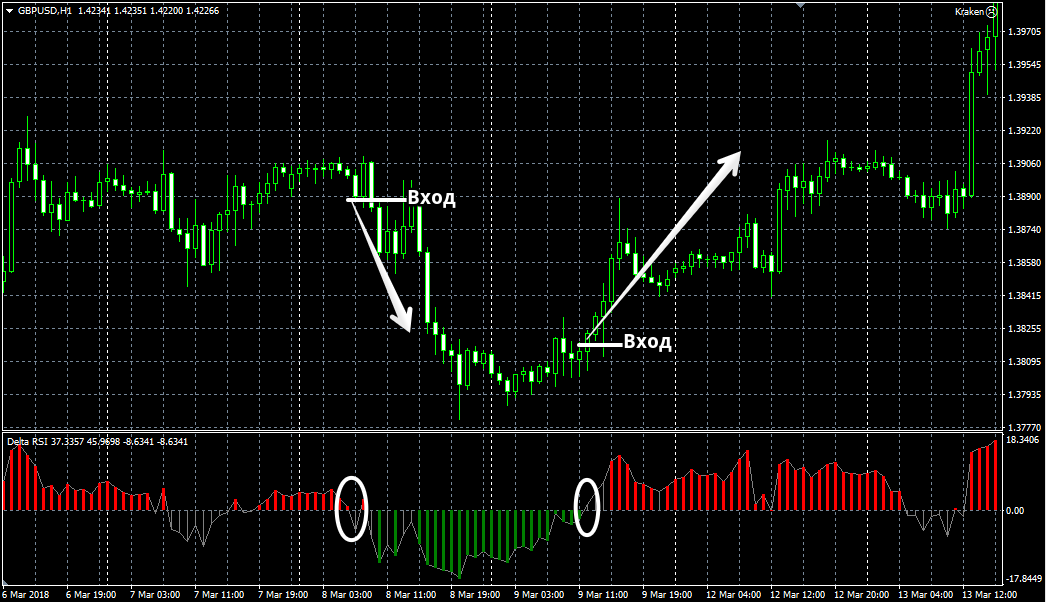
Settings The Delta RSI indicator can be used as a trend filter.
The location of the histogram above level 0 can be regarded as an upward trend, and below level 0 as a downward trend. Therefore, level 0 can be classified as a signal level, namely, if the histogram overcomes the central line 0 from bottom to top, we open a buy position, and if from top to bottom, we open a sell position.
You should also pay attention to the color of the histogram, as red indicates that the market is overbought, and green indicates that the market is oversold.
Thus, if you receive a buy signal at a time when the Delta RSI shows that the market is overbought, you should abandon such a trade and vice versa.
Thanks to the settings, the indicator can be reconfigured to suit your own trading style, as well as the tasks set for the indicator.
Thus, in the Fast RSI Period and Slow RSI Period variables, you can change the periods for calculating the fast and slow relative strength index. In the Signal Level variable, you can change the signal level, namely, if the slow RSI is above it, the histogram turns red, and if below it, the histogram turns green.
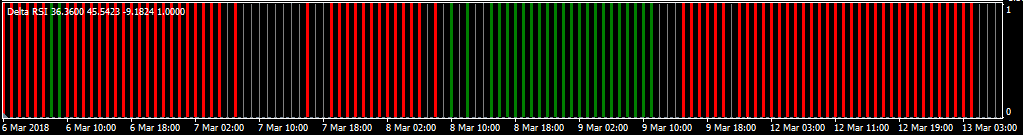
The Type graph variable allows you to switch the display of the graph type, namely, change it from a histogram to bars.
In conclusion, it is worth noting that the Delta RSI indicator is a more convenient implementation of a signal based on the intersection and interaction of fast and slow RSI with each other, which simplifies the process of market analysis.
Download the Delta RSI indicator