
Price dynamics indicator. Assess overbought and oversold prices in seconds
Not only the trading strategy is the main secret of success in Forex, but the asset being traded also plays an important role.
Any story of a successful trader , film or interview about how they conduct their trading begins not with trading, but with a careful selection and formation of a list of promising currency pairs on which to expect movement.
Surely you have a completely logical question: what criteria do traders use to evaluate assets?
As a rule, first of all, the price dynamics are assessed, namely, the percentage that the price has overcome relative to yesterday, week or month is calculated.
This allows you to quickly assess how overbought or oversold the market is and whether you should expect activity from the currency pair.
The indicator is primarily an auxiliary tool and is used to assess market conditions, so it can be used on absolutely all trading assets - stocks, currencies, indices or commodities.
The indicator can also be applied to any time frames, since the data obtained by this tool will be identical due to the characteristics of the tool.
Installing the Percentage indicator
In most modern web platforms, as well as stock exchange platforms, the function of sorting by growth and decline leaders in percentage terms is present by default; moreover, you can get acquainted with similar data for each specific asset.
At the same time, the most common trading platform among Forex traders, MT4, does not have this function, but it is implemented using the auxiliary Percentage indicator.
It is worth noting that the indicator is distributed completely free of charge; moreover, in 2016 it was published in the official MT4 library.
So, you can install this tool in two ways, namely through the built-in library or by downloading the file and installing through the data directory.
To install the Percentage price dynamics indicator through the library, launch your MT4 trading terminal, then in the “Terminal” panel, where information on your balance is located, move to the “Library” tab.
After the list appears, perform a simple sort so that the list is formed only by indicators. In the resulting list, find Percentage and use the additional menu as shown in the image below to download:

If installation via the library fails, you can resort to the standard scheme.
To do this, go to the end of the article and download the indicator, then install it by dropping the file into the appropriate folder in the terminal data directory, namely the indicators folder. After installation, be sure to restart the trading terminal or update it in the navigator panel, otherwise the indicator will not appear in the list of custom instruments.
Application practice.
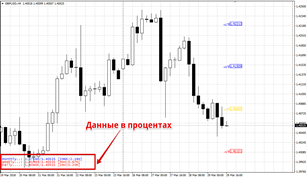
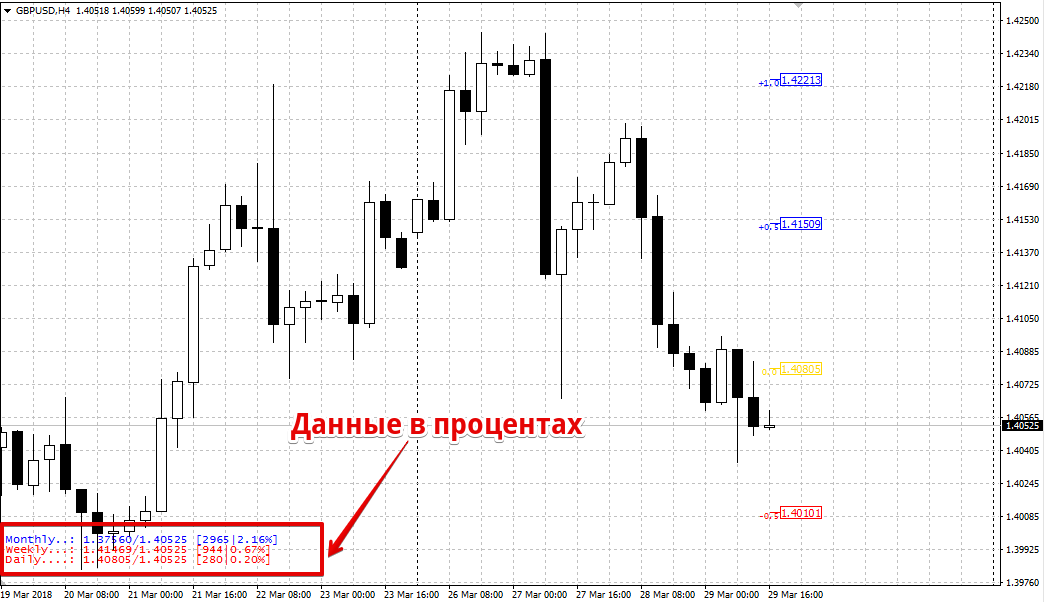
Appearance As we have already noted, the Percentage price dynamics indicator allows you to measure how much percent the price has deviated in one direction or another compared to the closing price of the day, week or month at the current moment.
This information is displayed as text at the very bottom of the graph, namely in the left corner.
If the values are shown in red, we see information about how many percent the price has fallen, and if in blue, we see how much percent the price has increased.
The price dynamics indicator can also be used as a signal tool.
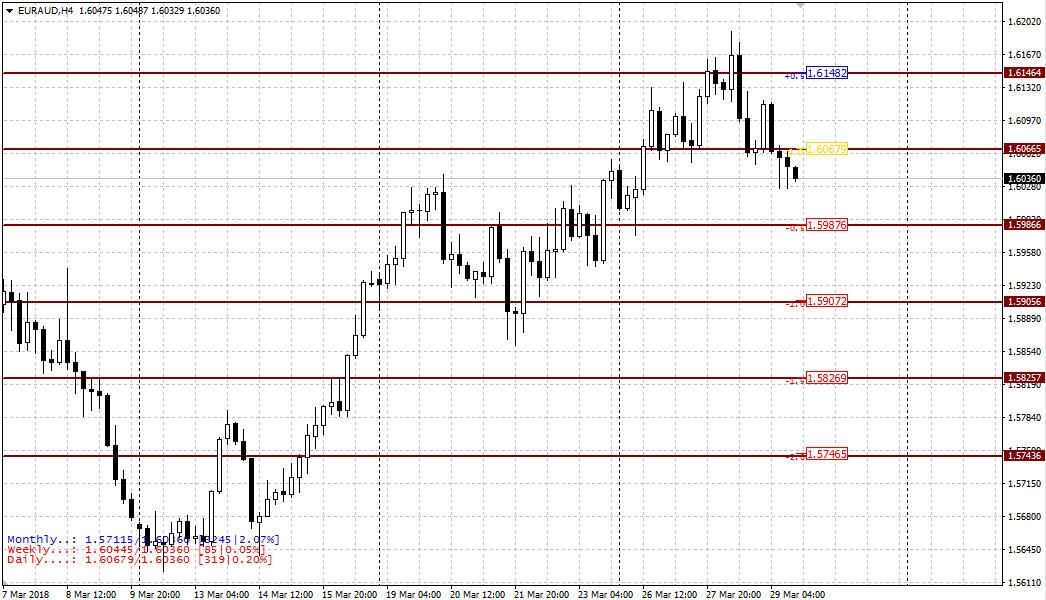
On the chart, in addition to data on the percentage change in price at the current moment, you can see dashes with the price in blue, yellow and red. Each of these lines indicates the percentage level by which the price may deviate. Draw horizontal lines through these lines and consider them as support and resistance levels .
You should trade not for a breakout, but for a return to some average value, especially if the price has a strong deviation.
In the indicator settings, you can change both the color scheme and display location, and enable or disable labels on the chart in the ShowPriceLabe line, which are disabled by default.
In conclusion, it is worth noting that the price dynamics indicator allows you to significantly expand the functionality of MT4, which will allow you to find strong deviations characterizing overbought or oversold assets in a matter of seconds.
Download the Percentage price dynamics indicator