
Indicator measuring Volatility "Extremum"
Volatility is one of the most underestimated characteristics of the market, and the trader pays for it with his deposit.
The volatility indicator, namely its proper calculation, allows you to avoid false triggering of stop orders, set the right goals and achieve them.
This indicator can be used not only as a filter, but also as a basis for creating a trading strategy.
For example, it is known for certain that before any strong reversal or price movement, there is a market compression, after which the price shoots out like a spring and travels huge distances in a matter of seconds.
Thanks to volatility, a trader can find similar market conditions and be prepared for the price to become active soon.
To measure this indicator, forex indicators of the same name are used, one of which is the Extremum indicator, which you will become familiar with in this article.
The tool itself can be considered universal, since it combines the characteristics of an oscillator, which is responsible for determining volatility, as well as a trend indicator, which clearly outlines the trend.
The Extremum indicator, like any other technical indicator that combines these two important market characteristics, can be used on all trading assets, without exception, that are available in your broker’s terminal.
Also, Extremum will be of interest to almost all traders due to the fact that it works with the historical period in bars and evaluates its extremes, which allows the indicator to give an objective assessment of what is happening on any time frame you choose.
Installing the Extremum indicator
Extremum is a time-tested tool that was created for the MT4 trading terminal back in 2010, when more and more new developments appeared almost every day.
It is worth noting that from the very first day Extremum was published in the official library of the MT4 trading terminal and was distributed free of charge, which means that you have two ways to install this tool.
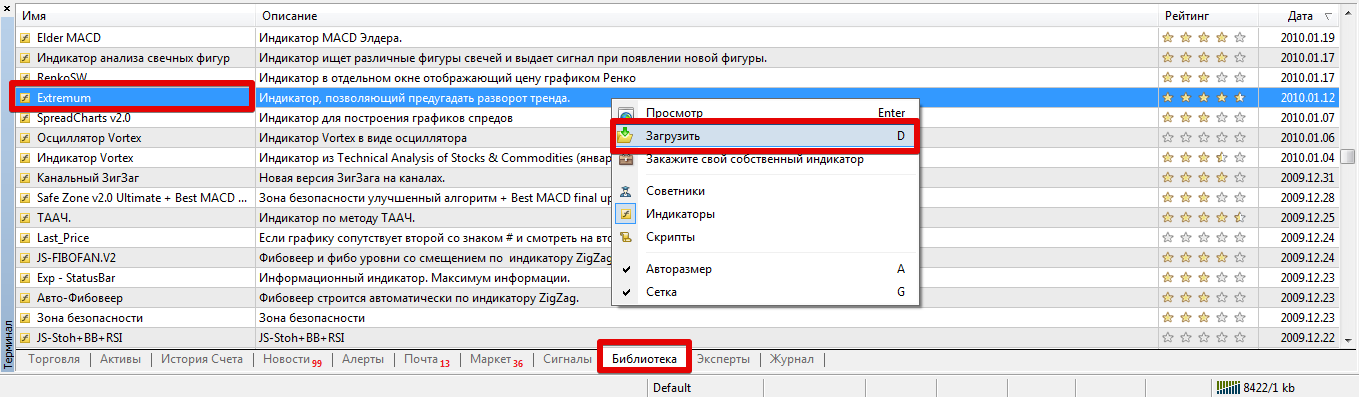
The first and easiest installation method is to download directly through the library. To do this, launch your trading terminal and move to the “Terminal” panel, where you can find up-to-date information on your transactions.
Then, the next step is to move to the “Library” tab and perform a simple sorting so that only indicators appear in the list.
Find Extremum in the sorted list and use the additional menu as shown below to download it:
If installation via the library caused difficulties, you can resort to the second installation method.
To do this, go to the end of the article and download the indicator, then place it in the appropriate folder of the terminal data directory, namely in the Indicators folder.
After installation, update your trading terminal in the “Navigator” panel, or restart the trading terminal altogether, otherwise Extremum will not appear in the list of custom indicators.
Application of the Extremum indicator
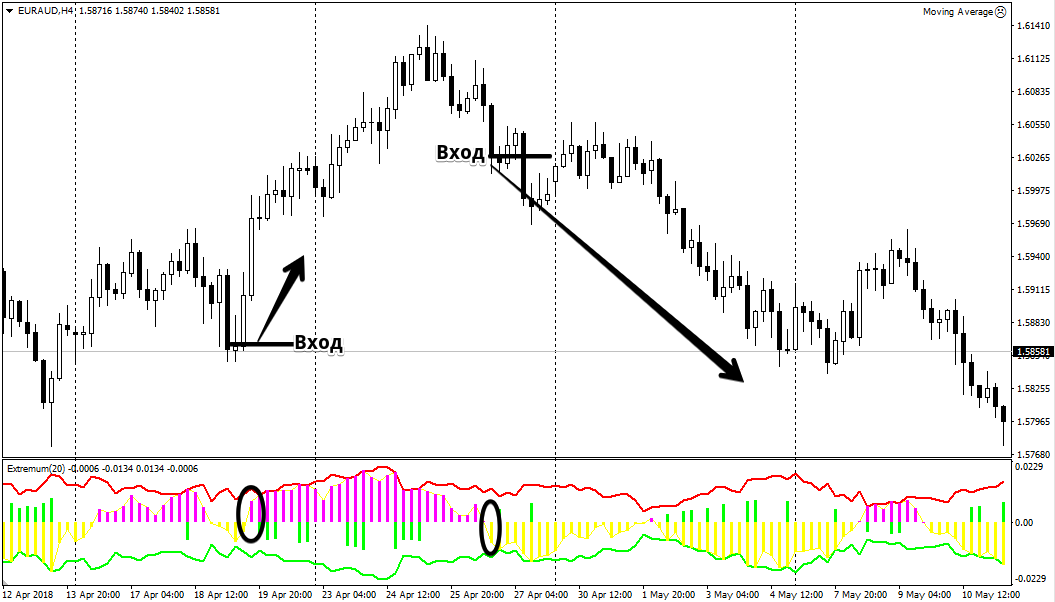
In fact, the main task of the Extremum indicator is to filter trades for reversal strategies, as well as filter positions for impulse strategies.
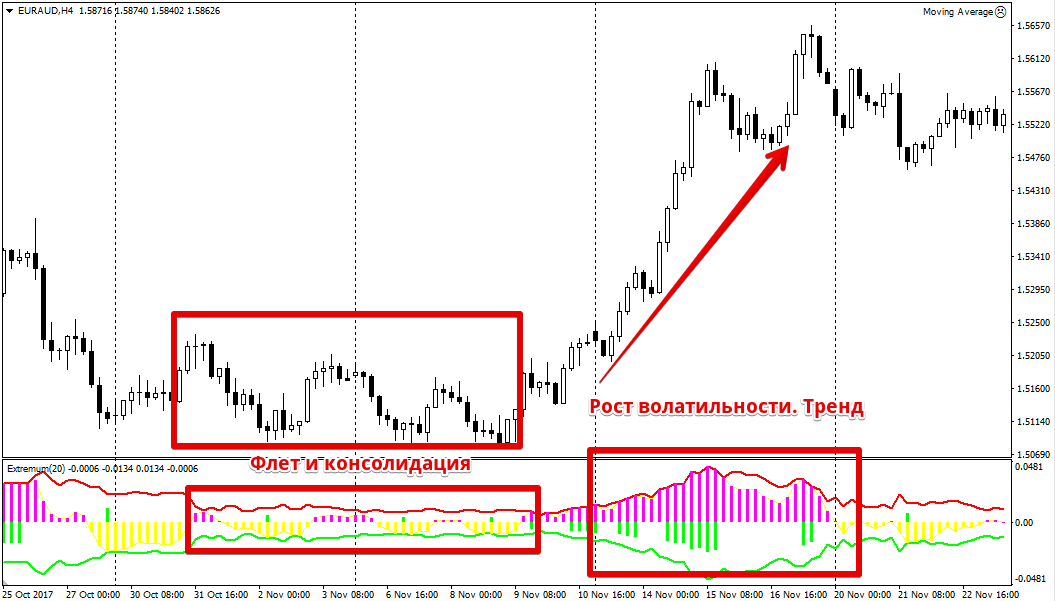
The fact is that the corridor or borders that the indicator shows in green and red are the same volatility channel. The principle of using this channel is in many ways similar to Bollinger Bands .
Namely, when the bands narrow, one can observe a decrease in volatility, and when they expand, on the contrary, an increase in volatility.
If your strategy is to trade reversals, then, as a rule, patterns are worked out at a narrowing of volatility in the so-called consolidation stage. If your strategy is impulse and is aimed at opening trades as the market moves, you need high volatility.
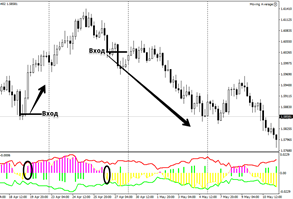
If you consider the secondary signal function of this indicator, pay attention to the indicator histogram.
Thus, the purple color of the bars indicates an upward price movement, and yellow indicates a downward movement. The histogram is divided by a zero line, which is a kind of trend equator.
Thus, if purple bars appear above level 0, we open a buy position, and if yellow bars appear below level 0, we open a sell position. Green bars can appear both above and below level 0, since they only indicate the presence of a trend, and not its direction.
In conclusion, it is worth noting that Extremum does an excellent job with its basic function of measuring volatility, since thanks to the channel you can visually observe its changes and find market consolidation .
Download the Extremum indicator