Support line indicator.
Regardless of the trend's movement, it's important to understand its lower boundary. This boundary is usually a support line, which is plotted based on the lows of a given time period.
This can be done in the trader's terminal using its graphical functions, but the drawback of this method is that the line will remain in the same position as the price lows change.
The support line indicator somewhat automates the construction process. It automatically selects the two most important points on a currency pair's chart and connects them.
In addition to plotting the line, the script also changes the support line'sdepending on the selected time frame and when the underlying points change.
Download the support line indicator.
After copying the script to your trader's terminal folder, simply add it to the chart of the currency pair you're working on.
The indicator is a godsend for a novice trader, as it requires no settings and can be used to develop a relatively simple Forex trading strategyor find better market entry points.
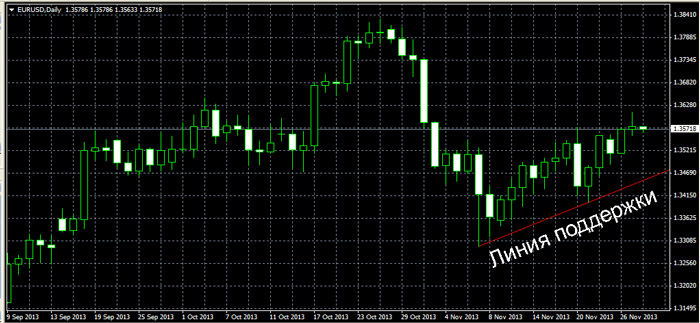
An example of using the support indicator.
1. A buy trade is opened if the price reaches the red line, reverses, and begins moving upward.
2. A sell trade is opened if, during an uptrend, the price breaks the support line and continues to move downward.
Overall, the performance of the support line indicator can be assessed as no more than satisfactory; aside from its simplicity, the Forex script has no other advantages.

