Forex lines (levels) indicator.
To understand price movement dynamics over a given time period, you need to plot support and resistance lines or use other levels.
This can be done manually or using technical analysis tools, such as the Forex levels indicator. These levels can also serve as price channel boundaries.
The Forex levels indicator automatically generates a grid of lines after installation, making it easy to use in most trading strategies.
The advantage of this indicator is its extreme simplicity, while, with the right approach, it allows you to easily identify the most favorable entry points.
The tool installation follows a standard scenario, after which you only need to perform simple configuration.
Setting up the Forex levels indicator.
Yesterday is the input data for calculating price levels. By default, it's set to 0, meaning the history is calculated in days. Setting it to 2 means data will be taken from the previous two days.
Levels is the number of lines displayed on the terminal screen. It's set to 20, and the display can be scaled for convenience.
The remaining settings concern the visual display of text and color scheme.
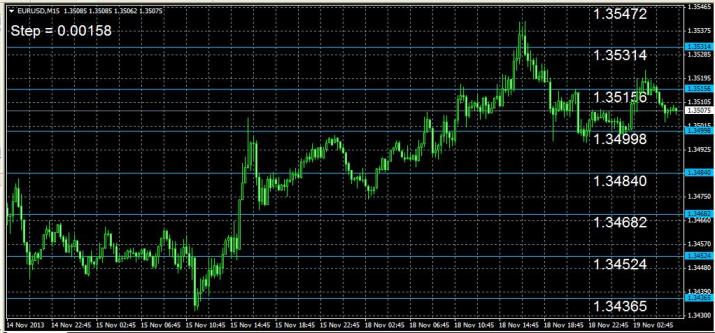
The Step indicator, which shows market fluctuations for the current date, is also displayed in the upper right corner of the screen.
This indicator can be used in trading strategies such as scalping, channel trading, and breakout trading.
Download the Forex level lines indicator.

