The Mouteki indicator. An implementation of Thomas DeMark's famous trend line construction
Thomas Demark became famous throughout the world not only for his phenomenal profitability and successful trading,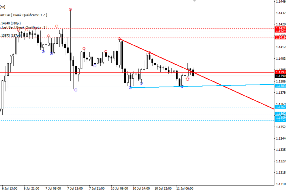
The most interesting thing is that DeMark himself never resorted to complex technical analysis techniques in his trading; moreover, he placed a huge emphasis on the most common trend lines.
However, while traders are still puzzled over which two extremes to use to construct a line, Thomas DeMark has clarified the construction rules, creating the concept of a pivot point and a clear algorithm for finding them.
It was the specification of DeMark's construction rules that allowed programmers to recreate many indicators using his methods, and the Mouteki indicator is one of them.
The indicator itself, like DeMark's trend lines, can be used on absolutely any currency pair or time frame, making the tool universal.
It's also worth noting that the Mouteki indicator not only plots trend lines, but also marks their intersections with an arrow and provides price targets for where the price might move after a breakout, making it an excellent signaling tool for any breakout trading strategy.
Installing the Mouteki indicator
The Mouteki indicator is a custom technical indicator, so to use it, you'll need to download the indicator from the link at the end of the article and then install it in your MT4 trading terminal.
The installation procedure for the Mouteki indicator is identical to that of any other custom indicator and follows a standard pattern. Specifically, you'll need to copy the downloaded file to the appropriate folder in your terminal's data directory.
To access the catalog, launch your MT4 trading terminal and select the "File" menu in the upper left corner. A list of options will then appear. Find the line labeled "Open Data Catalog" and click it.
After launching the catalog, a list of system folders will be displayed on your monitor screen. Among them, find a folder called indicators and drop the previously downloaded Mouteki indicator file into it.
Then, after installing the indicator, you need to update the platform in the navigator panel or restart the terminal, otherwise MT4 will not see the installed file.
After restarting the platform, Mouteki will appear in the list of custom indicators, and to start using it, simply drag the instrument name onto the chart.
The principle of using the Mouteki indicator
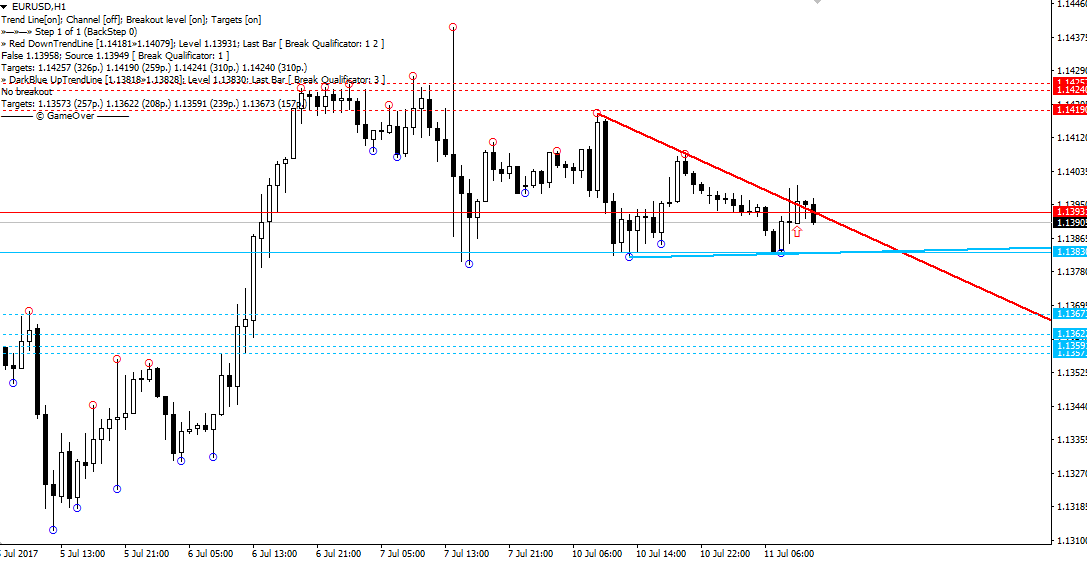
Once plotted on the chart, you can see two trend lines: a red one for a downtrend and a blue one for an uptrend. DeMark himself most often used signals based on a breakout of one of the trend lines.
So, if the price breaks the red trend line from the bottom up and an upward arrow appears, we enter a buy position. If the price breaks the blue trend line from the top down and a downward arrow appears, we enter a sell position.
The dotted lines of the corresponding color are potential targets in case of a breakout of a particular trend line.
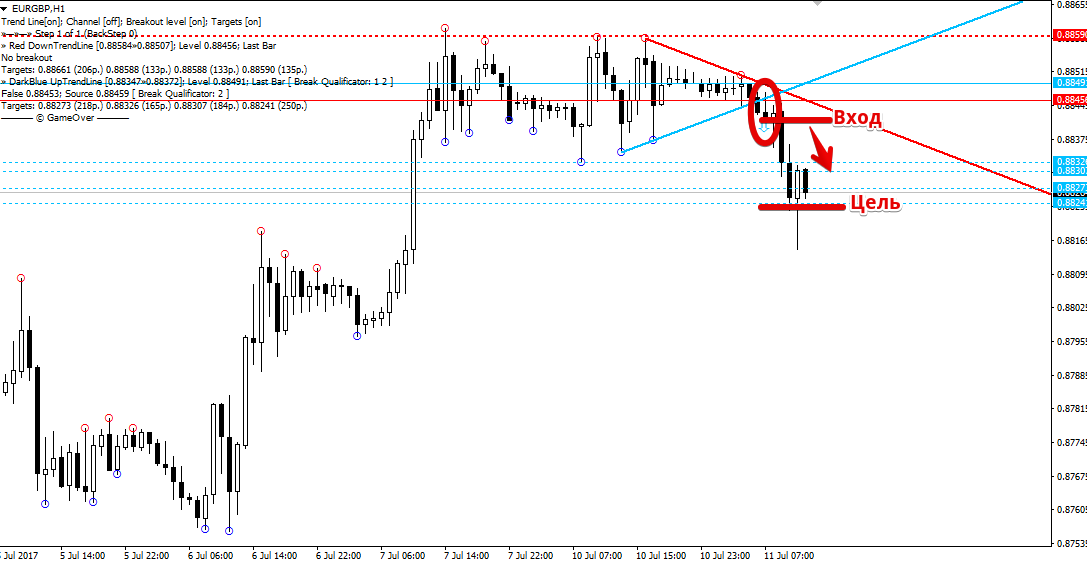
Besides breakout trading, you can also open positions on rebounds from trend lines. Specifically, if the price approaches and touches the red trend line, open a sell position. If the price approaches and touches the blue trend line, open a buy position.
Script settings
The indicator settings allow you to fundamentally change the process of constructing and displaying trend lines on the chart. Moreover, in the settings themselves, you can enable the function of constructing a symmetrical channel by constructing a parallel trend line.
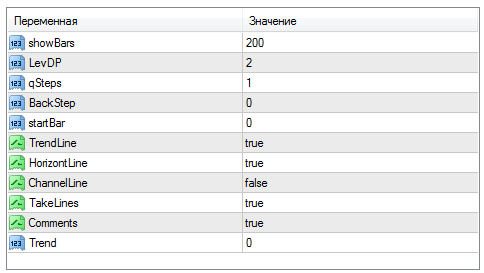
In the showBars line, you can specify in bars the historical period on which the indicator lines are displayed, and in the LevDP line, you can change the number of candles that should be below and above the central candle to form a reference point.
The qSteps and BackStep variables allow you to change the offsets from the reference points used to plot trend lines. The TrendLine variable enables or disables the display of trend lines on the chart, and the HorizontLine variable disables the display of the horizontal breakout level.
The ChannelLine variable allows you to enable the construction of channels, and the TakeLines variable allows you to enable or disable dotted target levels on the chart.
The Trend variable allows you to select the display mode for trend lines. If you set the number 1, only ascending lines are displayed; if 2, only descending trend lines are displayed; and if 0, both are displayed.
In conclusion, it is worth noting that the Mouteki indicator is the best version among all indicators that allow you to plot trend lines using the Thomas DeMark methodology.
Download Mouteki Indicator.

