4PMA Indicator. Automatic Channeling
Channel strategies are rightfully considered one of the most effective technical analysis tools.
The fact is that prices almost always trade within a certain range, sometimes deviating toward one of the invisible boundaries, sometimes bouncing back from it to conquer new extremes.
Thus, the emergence of trading tactics within a channel, which represents two strong support and resistance levels, is a common pattern in price observation.
However, while there is no doubt about the effectiveness of using channels to find market signals, many people have difficulty plotting them on a chart independently, especially when choosing extreme points and the prices at which to draw these lines.
The 4PMA indicator is a technical analysis tool that allows you to automatically build a price channel based on extreme points.
It's worth noting that, unlike other similar indicators, this tool not only draws channel lines, but also measures the price impulses of sellers and buyers, thus showing us whether the market is oversold or overbought.
The indicator itself is a universal assistant for traders, so it can be used on absolutely all currency pairs and time frames available in the MT4 trading terminal.
Installing the 4PMA indicator
The 4PMA indicator is a custom indicator, so to use it, you will need to download the indicator files at the end of the article and then follow the standard installation procedure in the MT4 trading terminal.
Installing the 4PMA indicator is practically no different from installing any other custom indicator, namely, you will need to dump the downloaded 4PMA indicator files into the appropriate folder in the terminal data directory.
To open the data folder, launch your MT4 trading terminal and go to the File menu in the upper left corner. Then, in the list of options that appears, find the line labeled "Open Data Folder" and click it.
After launching the data directory, a list of the platform's system folders will appear on your monitor screen. Among them, find a folder called Indicators and drop the indicators you downloaded at the end of the article into it.
In order for the trading terminal to see newly installed instruments, it should be updated in the navigator panel or restarted.
After restarting, 4PMA will appear in the list of custom indicators. To start using it, simply drag the instrument name onto the currency pair and time frame.
Using the 4PMA Indicator:
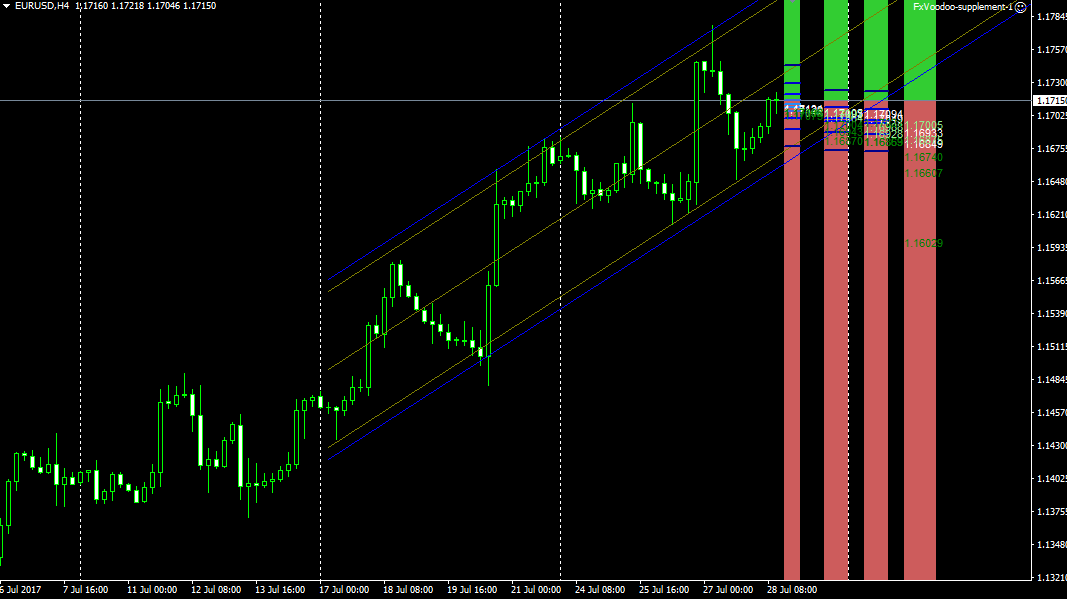
Channel trading occurs in two scenarios: a breakout of the channel boundaries or a rebound. Regarding rebound signals from channel boundaries, everything is very simple.
If the price approaches the lower channel boundary (blue line), open a long position. If the price approaches and touches the upper channel boundary, open a sell position.
It is also important to pay attention to the channel angle: if the channel is directed upward, priority is given only to buy positions, and if the channel is directed downward, priority is given only to sell positions.
It is important to understand that a channel breakout in the opposite direction to the angle indicates a change in the global trend.
So, if the price breaks through the lower channel boundary in an ascending channel, open a sell position. If the price breaks through the upper channel boundary in a descending channel, open a buy position.
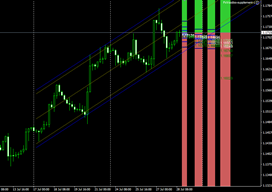
It's also very important to pay attention to the four bars on the right side of the chart, which are colored red and green.
If green is dominant and the price is near the upper peak of the channel, the market is overbought and a downward reversal is expected. If red bars are dominant at the lower boundary of the channel, the market is oversold and an upward reversal is expected.
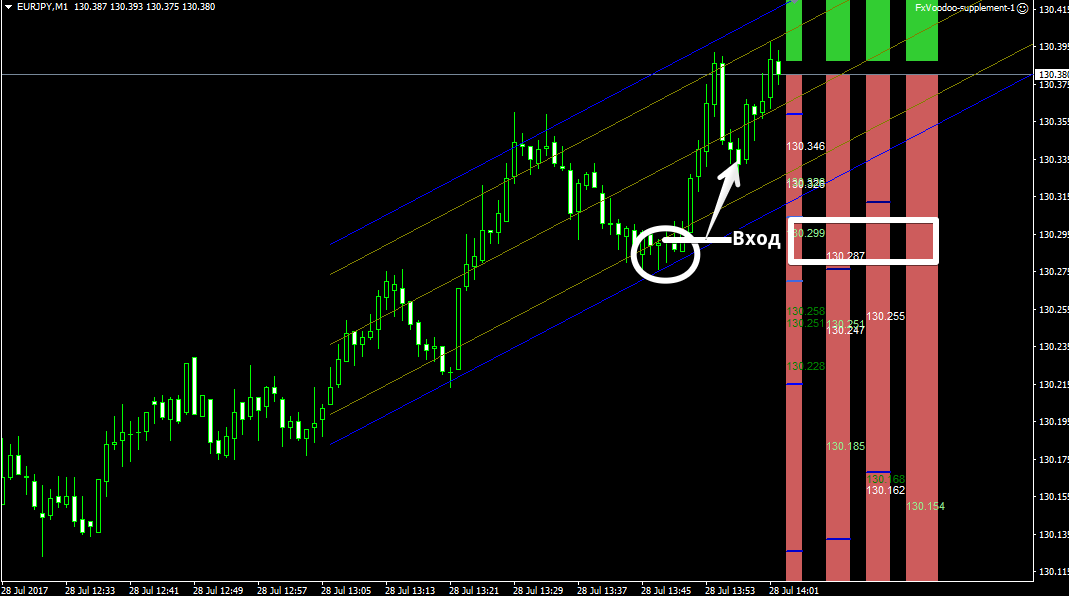
Thus, by combining overbought and oversold market conditions with a price rebound from one of the channel boundaries, you can obtain fairly accurate entries. Example:
4PMA Indicator Settings:
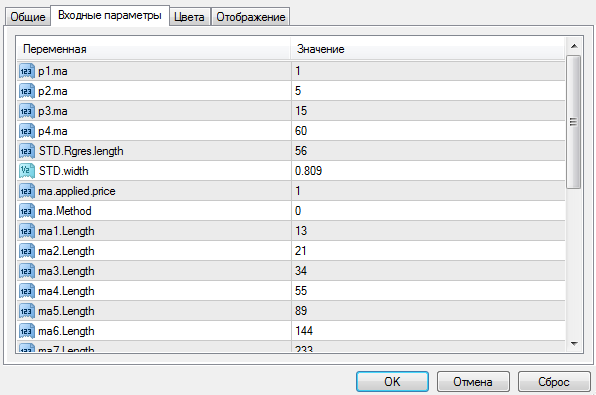
The indicator is based on two tools: moving averages and the regression channel itself.
The P1, 2, 3, and 4MA variables allow you to change the indicator's moving average periods, while the Ma applied price variable allows you to select the price at which the moving averages are applied.
The Ma method variable allows you to select the moving average type (simple, exponential, and so on). The STD Rgres length variable controls the number of candles used to construct the channel.
In conclusion, it's worth noting that the 4PMA indicator significantly simplifies a trader's life, especially due to its versatility in combining channels and measuring overbought and oversold market conditions.
4PMA can safely be considered a fully-fledged trading strategy that doesn't require additional filters.
Download the 4PMA indicator.

