Multi Info Table. Signals from 12 trading indicators in a single window
The indicators that are included by default in the MT4 trading terminal are worth considering, but it is impossible to use such a large number of tools simultaneously.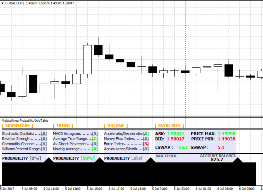
If you apply a large number of indicators to a chart, you will simply lose the ability to fully track price movements and apply graphical elements.
To avoid cluttering the chart's workspace, special information indicators were developed. They provide data from multiple indicators simultaneously in the form of a table or panel, without taking up much space on the chart.
The Multi Info Table indicator is a special information indicator that, like a radar, tracks changes in more than 12 standard indicators simultaneously and displays information on emerging signals to the trader.
In addition to tracking many indicators simultaneously, Multi Info Table also summarizes their data and displays the probability of price movement as a percentage in one direction or another.
Installing the Multi Info Table indicator
The Multi Info Table indicator was created specifically for use in the Forex market via the MT4 trading platform.
That's why, if you want to use the indicator, you should download the tool file at the end of the article and then install it on your trading platform.
The installation process for Multi Info Table is no different from installing any other custom indicator; you just need to copy the indicator file downloaded at the end of the article to the appropriate folder in the terminal's data directory.
To access the data catalog, launch your trading terminal and select the "File" menu in the upper left corner. Then, in the list of options that appears, find the line labeled "Open Data Catalog" and click it.
After launching the data directory, a list of the platform's system folders will be displayed on your monitor screen. Among these folders, you should find a folder called Indicators and drop the previously downloaded Multi Info Table indicator file into it.
After installing the indicator file, update the platform in the navigator panel or restart the platform, after which the Multi Info Table will appear in the list of custom indicators.
To start working with a tool, simply drag its name onto the chart.
The operating principle of the indicator
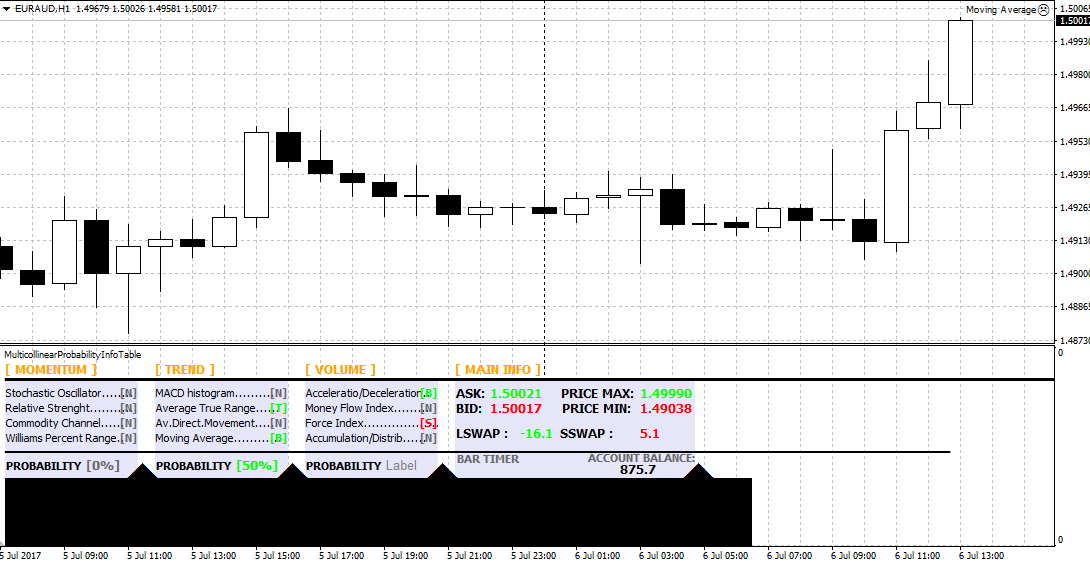
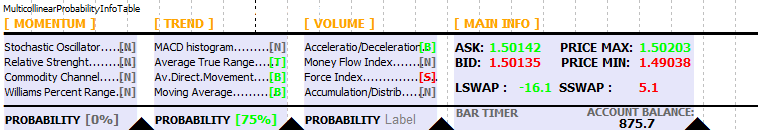
After applying the indicator to the chart, four columns will be displayed in front of you: Momentum, Trend, Value, Main Info.
So in the Momentum column you can see information on four oscillators, namely the Stochastic Oscillator, the Relative Strength Index, CCI and Wilams Percent Range.
The Trend column is represented by indicators such as MACD, Average True Range, Moving Average, Momentum.
The Volume column displays information on such volume indicators as AD, Money Flow Index, Force Index, AC.
When a buy signal appears on one of the indicators, a letter appears next to its name
B in green, and when a sell signal appears, the letter S appears opposite the indicator name.
Below each column there is a PROBABILITY line, which shows the probability of the price moving in one direction as a percentage.
The Main Info column also contains data on the minimum and maximum prices of the day, the current price, as well as swap data for the short and long position for the currency pair you selected.
It's important to understand that all indicators will never simultaneously give a buy or sell signal, and sometimes they may contradict each other.
Therefore, before using the indicator in practice, you should decide in advance which indicators you are going to use to monitor the market situation.
In conclusion, it's worth noting that the Multi Info Table indicator is primarily an assistant that significantly simplifies working with multiple standard indicators simultaneously and avoids excessive chart clutter and, as a result, platform glitches.
Download Multi Info Table

