Woodies CCI indicator
Standard indicators are the most popular tools technical analysis on the Forex market.
However, as they gain experience and knowledge, sooner or later every more experienced trader begins to doubt their informativeness and effectiveness.
This is simply due to the fact that each trader develops their own view of the market, their own ideas and developments.
Standard indicators reflected the ideas of the traders who created these instruments.
A lack of information and the trader's self-realization lead to popular standard indicators being constantly improved, refined, and modified beyond recognition.
Despite this, the new woodies cci tool has gained immense popularity among traders and has become an excellent part of the multitude Forex trading strategies.
The Woodies CCI indicator is a technical analysis tool based on two CCI indicators, one with a longer and one with a shorter period. The indicator was originally developed for the stock market, but over time, it has also come into widespread use in Forex.
It is worth noting that Woodies CCI is primarily an oscillator that performs a signal function.
The indicator itself is universal, meaning you can use it on any currency pair and time frame, making it an indispensable part of building your own strategy.
Installing the Woodies CCI indicator
As noted, Woodies CCI is a custom indicator, so to use it, you need to download the tool at the end of the article and then install it on the MT4 trading platform.
The installation process for Woodies CCI is no different from installing any other custom indicator, namely, you will need to drop the downloaded tool file into the appropriate folder in the terminal data directory.
Accessing the data catalog is quite simple. To do this, launch your trading platform and go to the "File" menu in the upper left corner. A list of options will appear, among which find and select "Open Data Catalog.".
After opening the directory, a list of the platform's system folders will appear on your monitor screen. Among them, find the folder named Indicators and drop the previously downloaded Woodies CCI indicator file into it.
In order for the trading terminal to see the installed file, you must close the data directory and update the terminal in the navigator panel, or simply restart it.
After restarting the platform, Woodies CCI will appear in the list of custom indicators, and to start using it, you need to drag the instrument name onto the chart.
Woodies CCI Indicator Application Practice
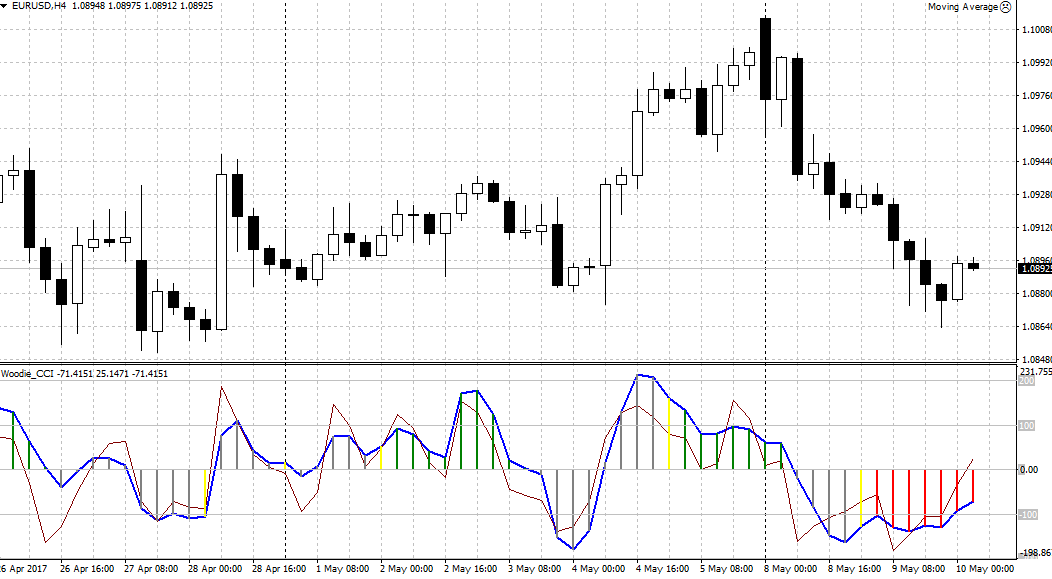
The Woodies CCI indicator offers a wealth of market signals, making it an excellent signaling tool. The first thing you should pay attention to is the indicator's histogram.
If the histogram is above its zero line, the market is in an upward trend, and if it is below its zero line, the market is in a downward trend.
Based on this, a fairly simple trend reversal signal emerges: if the histogram crosses the zero line from bottom to top, we enter a buy trade; if it crosses from top to bottom, we enter a sell trade. See the example below:
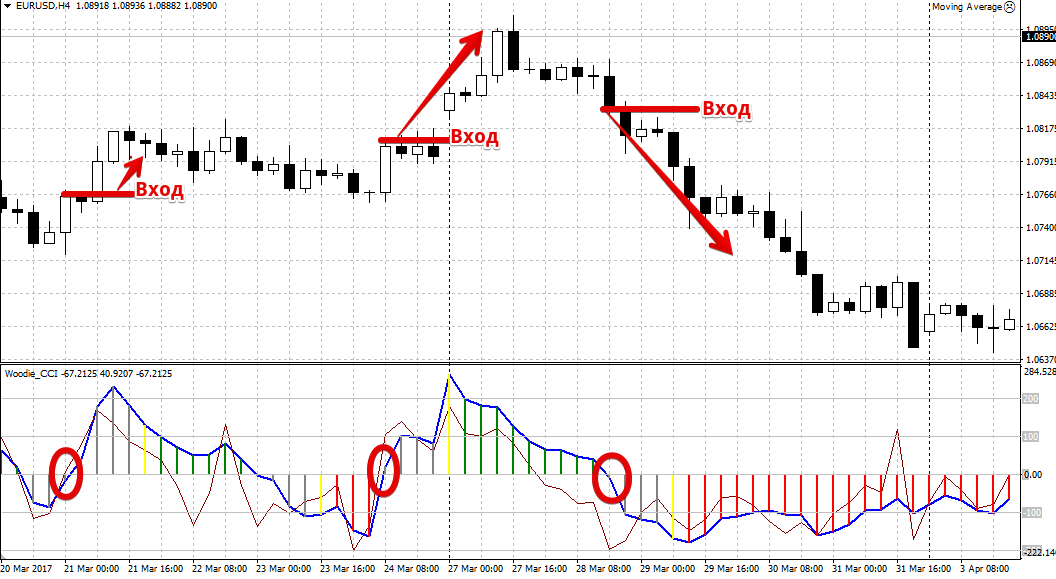
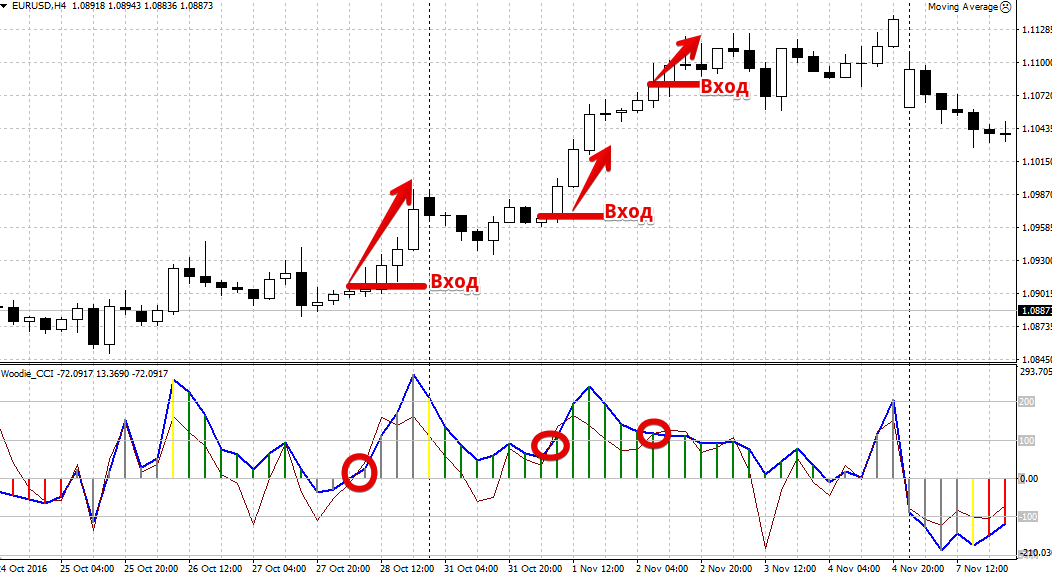
The second signal, often used as a secondary one for adding to the existing trend if the primary signal is missed, occurs when the indicator's signal lines cross. For example, a buy trade should be initiated if the histogram is above level 0 and the red line crosses the blue line from bottom to top.
A sell trade should be initiated when the histogram is below level 0 and the red line crosses the blue line from top to bottom. The intersection of these lines can also be used without the additional filter of the histogram. Example:
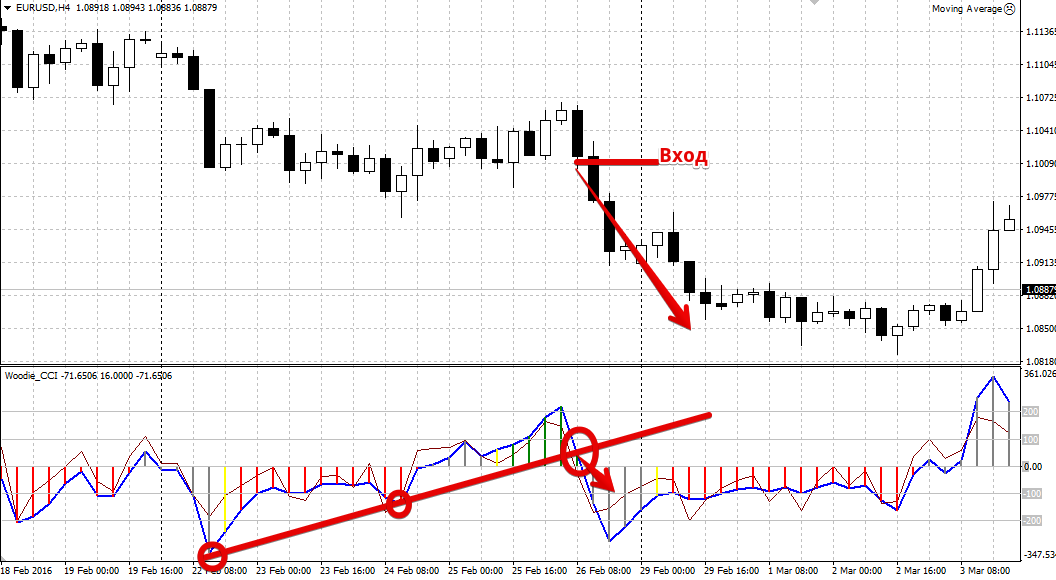
The author of the indicator himself recommended to carry out a simple graphical analysis on your own instrument, namely, to build a trend line based on the peaks from the blue line.
So, to plot a trend line, you'll need two peaks on the Woodies CCI indicator, and the market entry occurs immediately when the blue line breaks the trend line. For more details, see the image below:
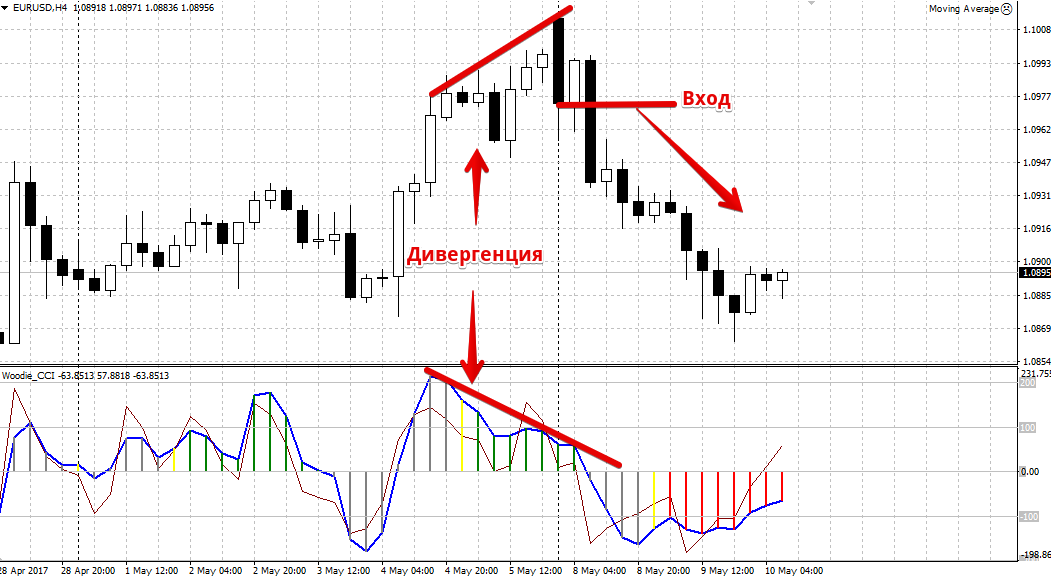
The Woodies CCI indicator also provides a leading "Divergence" signal. Divergence is the divergence of the histogram readings directly from the price.
So, if the price forms a new peak, and the indicator registers it as lower than the previous one, we enter a sell position. If the price makes a new low, and the indicator registers a trough smaller than the previous one, we enter a buy position.
For more details, I suggest you take a look at the example of divergence in the picture below:
In conclusion, it is worth noting that the Woodies CCI indicator is a huge storehouse of market signals.
However, it is important to understand that Woodies CCI is a standard technical analysis tool, so in order to avoid false signals, it is best used in conjunction with any other tool.
Download the Woodies CCI Indicator

